GA4 Free Form Exploration: 5 Easy Steps to Build Reports
Build a GA4 free form exploration in 5 easy steps with real screenshots, fix the 2 month data limit, avoid sampling, and save 5 ready made report recipes.


In this article
- What Is a GA4 Free Form Exploration?
- Change This Setting Before Your First GA4 Free Form Exploration
- How to Build a GA4 Free Form Exploration in 5 Steps
- Plan Your Next GA4 Free Form Exploration
- Segments, Filters and Sharing Explained
- GA4 Free Form Exploration Limits to Know
- Five GA4 Free Form Exploration Recipes to Save
- Frequently Asked Questions
- What We Learn Today
Hey there, and welcome! Today we are building a real custom report in GA4 together, click by click, using live data.
Standard GA4 reports answer the questions Google expected you to ask. The moment you want something specific, like which external websites your readers click through to most, you hit a wall. A GA4 free form exploration removes that wall. It is a drag and drop table where you choose the rows, the numbers and the filters yourself.
Every screenshot here was captured from a live GA4 property for a technical blog. We will build an outbound click report from a blank canvas, so you can copy the exact same steps on your own site.
Along the way, you will also learn the one data setting to change today, the limits that quietly change your numbers, and five ready made report recipes.
What Is a GA4 Free Form Exploration?
Explore is the custom analysis area of GA4, opened from the compass icon in the left menu. It offers several techniques, and free form is the one you will use most.
A GA4 free form exploration is essentially a pivot table. You drop dimensions into rows and columns, add metrics as values, and slice everything with filters or segments.
Piotr Litwa's explorations guide describes free form as the workhorse for ad hoc questions, and estimates it should cover most of the explorations you build.
The screen has three columns. Variables on the left holds your building blocks, Settings in the middle decides how they are arranged, and the canvas on the right shows the result.
Change This Setting Before Your First GA4 Free Form Exploration
Here is the surprise that catches almost everyone. By default, explorations can only see the last two months of event data.
Google's data retention help page confirms you can choose 2 or 14 months on a standard property, and that this setting only affects explorations and funnel reports. Your standard reports are not limited this way.
- Open Admin.
- Under Data collection and modification, click Data retention.
- Change Event data retention to 14 months and click Save.
The change is not retroactive. Analytics Mania explains that you still cannot select more than two months right away, because the longer history only builds up from the day you switch.
If a standard property grows large enough to be classed as Large, Google automatically reduces event data retention to 2 months, and older event data becomes inaccessible.
How to Build a GA4 Free Form Exploration in 5 Steps
Our goal is simple: a table showing which external domains and URLs visitors clicked, ranked by clicks. GA4 already sends this data automatically through outbound click tracking.
Step 1: Start a blank free form
Click Explore in the left menu, then click the Free form template. GA4 opens a new exploration with a sample table of cities and devices.
Click the Exploration name field at the top of the Variables column and give it a clear name, such as "Outbound link clicks". Explorations are saved automatically as you work.
Step 2: Import the dimensions you need
Click the plus icon next to Dimensions. A picker opens with every dimension available in the property, grouped by category.
Search for "link" and tick Link domain, Link URL and Outbound. These are predefined, so no custom setup is needed.
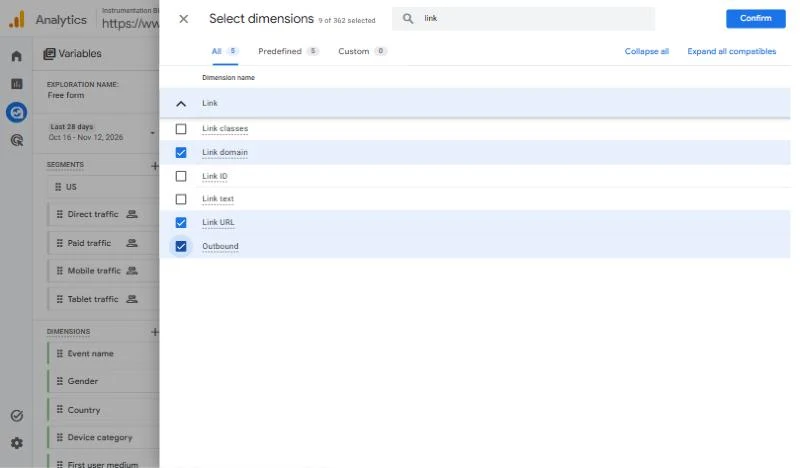
The dimension picker with the three Link dimensions selected. Click Confirm to add them to the Variables column.
Click Confirm. The new dimensions appear in the Variables column, ready to use.
Step 3: Set rows and values
In the Settings column, remove the default City row by hovering over it and clicking the small cross. Then add Link domain and Link URL as rows.
Remove Device category from Columns, so the table stays simple. Under Values, swap Active users for Event count.
Tip
You can also drag a dimension straight from the Variables column into Rows. Double clicking it works too and adds it to Rows instantly.
Step 4: Filter to outbound clicks only
Without a filter, Link URL picks up values from several events, including file downloads. Scroll to Filters, click the drop zone and choose Event name.
Set the condition to exactly matches, type click, and click Apply.
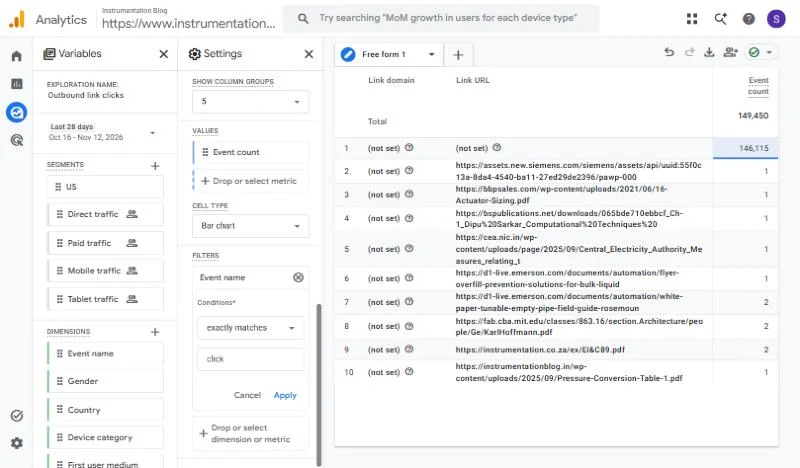
The filter set to Event name exactly matches click. Before applying it, the table still shows mixed rows with a large (not set) total.
Step 5: Read and sort the result
The table now lists every outbound domain and URL with its click count. Click the Event count header to sort from highest to lowest.
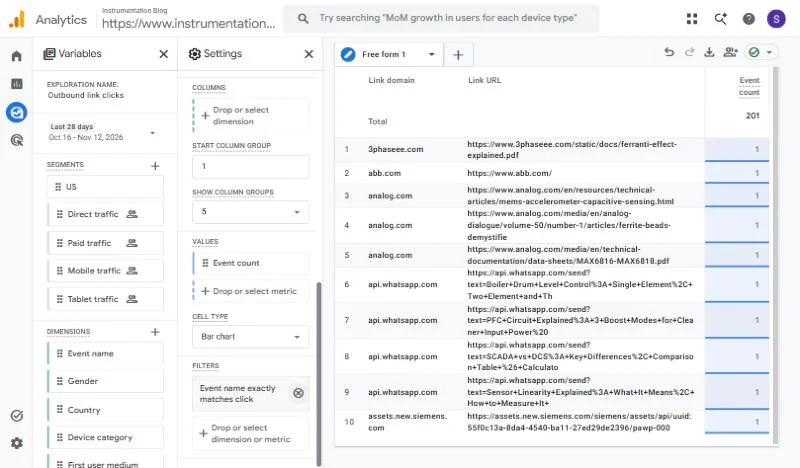
The finished report. 201 outbound clicks across domains like abb.com, analog.com and api.whatsapp.com.
Want a chart instead of a table? The Visualization icons in the Settings column switch the same data to a donut, line, bar, scatter or geo map view in one click.
For a report like this one, the table usually works best, because long URLs are hard to read on a chart. A bar chart of Link domain alone, without Link URL, is a nice visual for a monthly slide.
Notice the total of 201. It matches the click event count in the standard Events report for the same 28 days, which is a quick way to confirm your filter is correct.
Plan Your Next GA4 Free Form Exploration
Once you have built one report, the same pattern works for almost any question. The builder below gives you the exact settings for common marketing questions.
It also estimates whether your date range is likely to trigger sampling, based on how many events your property records per day.
Free Form Recipe Builder
Pick a question to get the rows, values and filter to use.
Sampling check
The sampling check uses the threshold from Clickport's breakdown of GA4 sampling, which explains that a standard property samples once a query passes about 10 million events for the date range.
Most small and medium sites never get close. Large ecommerce or media sites can, especially across a full year.
Segments, Filters and Sharing Explained
Filters and segments look similar, but they behave differently. Mixing them up is a common reason two tabs show different totals.
| Feature | What it does | Best for |
|---|---|---|
| Filter | Limits the rows in this one tab | Showing only one event, page or country |
| Segment | Defines a group of users, sessions or events you can reuse | Comparing groups side by side, such as mobile versus desktop |
| Segment comparison | Adds a column per segment in the same table | Quick before and after or audience comparisons |
Stackmatix's explorations guide calls confusing a filter for a segment a classic reason an exploration looks fine in one tab and wrong in another.
Explorations are private by default. Use the share icon at the top of the canvas to share a read only copy with colleagues who have access to the property.
Tip
Add a second tab with the plus button next to the tab name. You can keep a filtered version and an unfiltered version of the same report side by side.
GA4 Free Form Exploration Limits to Know
Explorations query raw event data, which makes them powerful but also subject to a few limits. Knowing them stops you from trusting a number that is quietly estimated.
Sampling on very large queries
When sampling kicks in, a shield icon at the top right of the canvas turns yellow. Hover over it to see what percentage of data GA4 used.
The fix is usually a shorter date range. Run two smaller explorations instead of one huge one, then combine the results.
The (other) row
A dimension with thousands of unique values, such as a full page path or URL, can push smaller rows into a single "(other)" line. Stackmatix notes this is a cardinality limit, not classic sampling.
Data thresholds
When Google signals is active, GA4 may hide rows with very small numbers to protect user privacy. Your totals will look lower than the standard reports on small segments.
Relevant Audience's guide to explorations covers how sampling and thresholds change the numbers you see, and when an exploration beats a standard report.
A cap on saved explorations
Each user can only create a limited number of explorations per property. Analytify's GA4 limits table lists 200 created per user and 500 shared per property, so delete test reports you no longer need.
Five GA4 Free Form Exploration Recipes to Save
Build each of these once and keep it. Together they answer most of the questions marketers ask every month.
| Report | Rows | Values | Filter |
|---|---|---|---|
| Outbound clicks | Link domain, Link URL | Event count | Event name is click |
| File downloads | File name, Page path | Event count | Event name is file_download |
| Site search terms | Search term | Event count, Total users | Event name is view_search_results |
| Landing page quality | Landing page | Sessions, Engagement rate, Key events | None |
| Campaign by device | Session campaign | Sessions, Key events | Columns: Device category |
The first three rely on automatic events. Our GA4 enhanced measurement guide shows how to make sure those events are switched on.
If you want to report on a parameter that is not predefined, register it first. Our step by step guide to custom dimensions in GA4 covers that in a few minutes.
Campaign reports work best when your links carry clean tags. Our UTM parameters guide explains how to set them up consistently.
Once these five are saved, your monthly reporting becomes a matter of opening Explore and changing the date range. That is the real payoff of learning the GA4 free form exploration properly.
Frequently Asked Questions
Your event data retention is set to the default of 2 months. Change it to 14 months under Admin, Data retention. Older data will not come back, but history builds from that day.
Yes. Every change is saved as you work, and the exploration appears in the list on the Explore page next time.
Common causes are sampling on large queries, data thresholds on small segments, a filter you forgot about, or a date range that reaches past your retention period.
Yes. Use the download icon at the top of the canvas to export to Google Sheets, CSV, TSV or PDF.
Only for parameters that are not predefined. Common ones like Link URL, File name and Search term are already available.
What We Learn Today
A Pivot Table
Free form lets you choose rows, columns, values and filters yourself.
Fix Retention First
Switch event data retention to 14 months before you need history.
Import Variables
Dimensions and metrics must be added to Variables before use.
Filter vs Segment
Filters trim one tab. Segments define reusable groups to compare.
Check the Shield
A yellow shield icon means the result is sampled.
Cross Check Totals
Compare your total with the standard Events report to confirm filters.
Build Reports That Answer Real Questions
You now know how to build, filter and trust a GA4 free form exploration. Next, make sure the data feeding it is complete.