
- Home
- SEODiscover the latest updates from across the United States, including politics, culture, economy, and trending stories. Stay informed on the key events shaping the nation and the topics everyone’s talking about.
- Technical SEOLearn technical SEO concepts including crawling, indexing, XML sitemaps, robots.txt, canonical tags, site architecture, and website performance.
- Local SEOOptimize your business for local seo with Google Business Profile, local citations, reviews, maps, and location-based SEO.
- Mobile SEOImprove your website’s mobile seo performance with responsive design, mobile-first indexing, usability, and page speed optimization.
- On-Page SEOExplore on-page seo optimization techniques such as title tags, meta descriptions, headings, URLs, internal linking, and content optimization.
- Off-Page SEODiscover off-page SEO strategies such as backlinks, digital PR, brand mentions, outreach, and authority building.
- SEO ToolsExplore the best SEO tools for keyword research, technical audits, backlink analysis, rank tracking, and website optimization.
- Core Web VitalsLearn how to improve Core Web Vitals including LCP, INP, CLS, page speed, and overall user experience for better rankings.
- Keyword ResearchLearn how to find profitable keywords, analyze search intent, evaluate competition, and build effective keyword strategies.
- Link BuildingMaster ethical link building techniques, backlink analysis, outreach methods, guest posting, and authority growth strategies.
- Google Search ConsoleLearn how to use Google Search Console to monitor indexing, fix errors, analyze search performance, and improve SEO.
- SEO BasicsLearn the fundamentals of search engine optimization (SEO Basics), including how search engines work, SEO terminology, and beginner-friendly best practices.
- Paid Media
- Display AdvertisingLearn display advertising strategies, banner ads, audience targeting, remarketing, Google Display campaigns, and optimization techniques.
- Google AdsLearn Google Ads strategies, campaign setup, bidding, keywords, Performance Max, Search Ads, and optimization techniques.
- LinkedIn AdsLearn LinkedIn Ads strategies for B2B marketing, lead generation, audience targeting, campaign optimization, and paid social advertising.
- Meta AdsLearn Meta Ads strategies for Facebook and Instagram, including campaign setup, targeting, retargeting, and performance optimization.
- Paid Media AnalyticsLearn paid media analytics, including CPC, CTR, CPA, ROAS, conversion tracking, attribution, reporting, and campaign performance analysis.
- PPC StrategyLearn effective PPC strategies, campaign planning, bidding, keyword targeting, landing pages, conversion optimization, and more.
- ContentTransform your living spaces with inspiration, tips, and trends in interior design. From minimalist decor to bold statements, find ideas for every style and budget.
- Social
- Digital MarketingExplore stories and advice on living your best life. From personal growth to entertainment, dive into the latest in lifestyle trends and inspiration.
- Artificial IntelligenceStay informed about health and wellness with expert advice, fitness tips, and the latest medical breakthroughs. Your guide to a healthier and happier life.
- DevelopmentYou will find development related educational articles
- GTMLearn Google Tag Manager (GTM) with practical guides for tags, triggers, variables, tracking, conversions, and website analytics implementation.
- HTMLLearn HTML with simple tutorials, examples, tags, elements, attributes, and best practices for building modern web pages.
- HTML CSSLearn HTML CSS together with practical tutorials, examples, layouts, styling techniques, responsive design, and modern web development practices.
- HTML JSLearn HTML JS – JavaScript with practical tutorials and examples for adding interactivity, dynamic content, events, and functionality to web pages.
- JavaScriptExplore JavaScript tutorials, examples, concepts, and practical techniques for creating interactive and dynamic websites and web applications.
- PHPLearn PHP programming with practical tutorials, examples, functions, syntax, and web development techniques for beginners and developers.
- PythonLearn Python programming with practical tutorials, examples, syntax, functions, automation techniques, and useful programming concepts.
- Home
- SEODiscover the latest updates from across the United States, including politics, culture, economy, and trending stories. Stay informed on the key events shaping the nation and the topics everyone’s talking about.
- Technical SEOLearn technical SEO concepts including crawling, indexing, XML sitemaps, robots.txt, canonical tags, site architecture, and website performance.
- Local SEOOptimize your business for local seo with Google Business Profile, local citations, reviews, maps, and location-based SEO.
- Mobile SEOImprove your website’s mobile seo performance with responsive design, mobile-first indexing, usability, and page speed optimization.
- On-Page SEOExplore on-page seo optimization techniques such as title tags, meta descriptions, headings, URLs, internal linking, and content optimization.
- Off-Page SEODiscover off-page SEO strategies such as backlinks, digital PR, brand mentions, outreach, and authority building.
- SEO ToolsExplore the best SEO tools for keyword research, technical audits, backlink analysis, rank tracking, and website optimization.
- Core Web VitalsLearn how to improve Core Web Vitals including LCP, INP, CLS, page speed, and overall user experience for better rankings.
- Keyword ResearchLearn how to find profitable keywords, analyze search intent, evaluate competition, and build effective keyword strategies.
- Link BuildingMaster ethical link building techniques, backlink analysis, outreach methods, guest posting, and authority growth strategies.
- Google Search ConsoleLearn how to use Google Search Console to monitor indexing, fix errors, analyze search performance, and improve SEO.
- SEO BasicsLearn the fundamentals of search engine optimization (SEO Basics), including how search engines work, SEO terminology, and beginner-friendly best practices.
- Paid Media
- Display AdvertisingLearn display advertising strategies, banner ads, audience targeting, remarketing, Google Display campaigns, and optimization techniques.
- Google AdsLearn Google Ads strategies, campaign setup, bidding, keywords, Performance Max, Search Ads, and optimization techniques.
- LinkedIn AdsLearn LinkedIn Ads strategies for B2B marketing, lead generation, audience targeting, campaign optimization, and paid social advertising.
- Meta AdsLearn Meta Ads strategies for Facebook and Instagram, including campaign setup, targeting, retargeting, and performance optimization.
- Paid Media AnalyticsLearn paid media analytics, including CPC, CTR, CPA, ROAS, conversion tracking, attribution, reporting, and campaign performance analysis.
- PPC StrategyLearn effective PPC strategies, campaign planning, bidding, keyword targeting, landing pages, conversion optimization, and more.
- ContentTransform your living spaces with inspiration, tips, and trends in interior design. From minimalist decor to bold statements, find ideas for every style and budget.
- Social
- Digital MarketingExplore stories and advice on living your best life. From personal growth to entertainment, dive into the latest in lifestyle trends and inspiration.
- Artificial IntelligenceStay informed about health and wellness with expert advice, fitness tips, and the latest medical breakthroughs. Your guide to a healthier and happier life.
- DevelopmentYou will find development related educational articles
- GTMLearn Google Tag Manager (GTM) with practical guides for tags, triggers, variables, tracking, conversions, and website analytics implementation.
- HTMLLearn HTML with simple tutorials, examples, tags, elements, attributes, and best practices for building modern web pages.
- HTML CSSLearn HTML CSS together with practical tutorials, examples, layouts, styling techniques, responsive design, and modern web development practices.
- HTML JSLearn HTML JS – JavaScript with practical tutorials and examples for adding interactivity, dynamic content, events, and functionality to web pages.
- JavaScriptExplore JavaScript tutorials, examples, concepts, and practical techniques for creating interactive and dynamic websites and web applications.
- PHPLearn PHP programming with practical tutorials, examples, functions, syntax, and web development techniques for beginners and developers.
- PythonLearn Python programming with practical tutorials, examples, syntax, functions, automation techniques, and useful programming concepts.
Now Reading: Google Analytics 4 Metrics Explained: A Beginner’s Guide
-
01
Google Analytics 4 Metrics Explained: A Beginner’s Guide
- Home//
- SEO//Discover the latest updates from across the United States, including politics, culture, economy, and trending stories. Stay informed on the key events shaping the nation and the topics everyone’s talking about.
- Technical SEO//Learn technical SEO concepts including crawling, indexing, XML sitemaps, robots.txt, canonical tags, site architecture, and website performance.
- Local SEO//Optimize your business for local seo with Google Business Profile, local citations, reviews, maps, and location-based SEO.
- Mobile SEO//Improve your website’s mobile seo performance with responsive design, mobile-first indexing, usability, and page speed optimization.
- On-Page SEO//Explore on-page seo optimization techniques such as title tags, meta descriptions, headings, URLs, internal linking, and content optimization.
- Off-Page SEO//Discover off-page SEO strategies such as backlinks, digital PR, brand mentions, outreach, and authority building.
- SEO Tools//Explore the best SEO tools for keyword research, technical audits, backlink analysis, rank tracking, and website optimization.
- Core Web Vitals//Learn how to improve Core Web Vitals including LCP, INP, CLS, page speed, and overall user experience for better rankings.
- Keyword Research//Learn how to find profitable keywords, analyze search intent, evaluate competition, and build effective keyword strategies.
- Link Building//Master ethical link building techniques, backlink analysis, outreach methods, guest posting, and authority growth strategies.
- Google Search Console//Learn how to use Google Search Console to monitor indexing, fix errors, analyze search performance, and improve SEO.
- SEO Basics//Learn the fundamentals of search engine optimization (SEO Basics), including how search engines work, SEO terminology, and beginner-friendly best practices.
- Paid Media//
- Display Advertising//Learn display advertising strategies, banner ads, audience targeting, remarketing, Google Display campaigns, and optimization techniques.
- Google Ads//Learn Google Ads strategies, campaign setup, bidding, keywords, Performance Max, Search Ads, and optimization techniques.
- LinkedIn Ads//Learn LinkedIn Ads strategies for B2B marketing, lead generation, audience targeting, campaign optimization, and paid social advertising.
- Meta Ads//Learn Meta Ads strategies for Facebook and Instagram, including campaign setup, targeting, retargeting, and performance optimization.
- Paid Media Analytics//Learn paid media analytics, including CPC, CTR, CPA, ROAS, conversion tracking, attribution, reporting, and campaign performance analysis.
- PPC Strategy//Learn effective PPC strategies, campaign planning, bidding, keyword targeting, landing pages, conversion optimization, and more.
- Content//Transform your living spaces with inspiration, tips, and trends in interior design. From minimalist decor to bold statements, find ideas for every style and budget.
- Social//
- Digital Marketing//Explore stories and advice on living your best life. From personal growth to entertainment, dive into the latest in lifestyle trends and inspiration.
- Artificial Intelligence//Stay informed about health and wellness with expert advice, fitness tips, and the latest medical breakthroughs. Your guide to a healthier and happier life.
- Development//You will find development related educational articles
- GTM//Learn Google Tag Manager (GTM) with practical guides for tags, triggers, variables, tracking, conversions, and website analytics implementation.
- HTML//Learn HTML with simple tutorials, examples, tags, elements, attributes, and best practices for building modern web pages.
- HTML CSS//Learn HTML CSS together with practical tutorials, examples, layouts, styling techniques, responsive design, and modern web development practices.
- HTML JS//Learn HTML JS – JavaScript with practical tutorials and examples for adding interactivity, dynamic content, events, and functionality to web pages.
- JavaScript//Explore JavaScript tutorials, examples, concepts, and practical techniques for creating interactive and dynamic websites and web applications.
- PHP//Learn PHP programming with practical tutorials, examples, functions, syntax, and web development techniques for beginners and developers.
- Python//Learn Python programming with practical tutorials, examples, syntax, functions, automation techniques, and useful programming concepts.
- Home
- SEO
- Technical SEO
- Google Analytics 4 Metrics Explained: A Beginner’s Guide
Google Analytics 4 Metrics Explained: A Beginner’s Guide

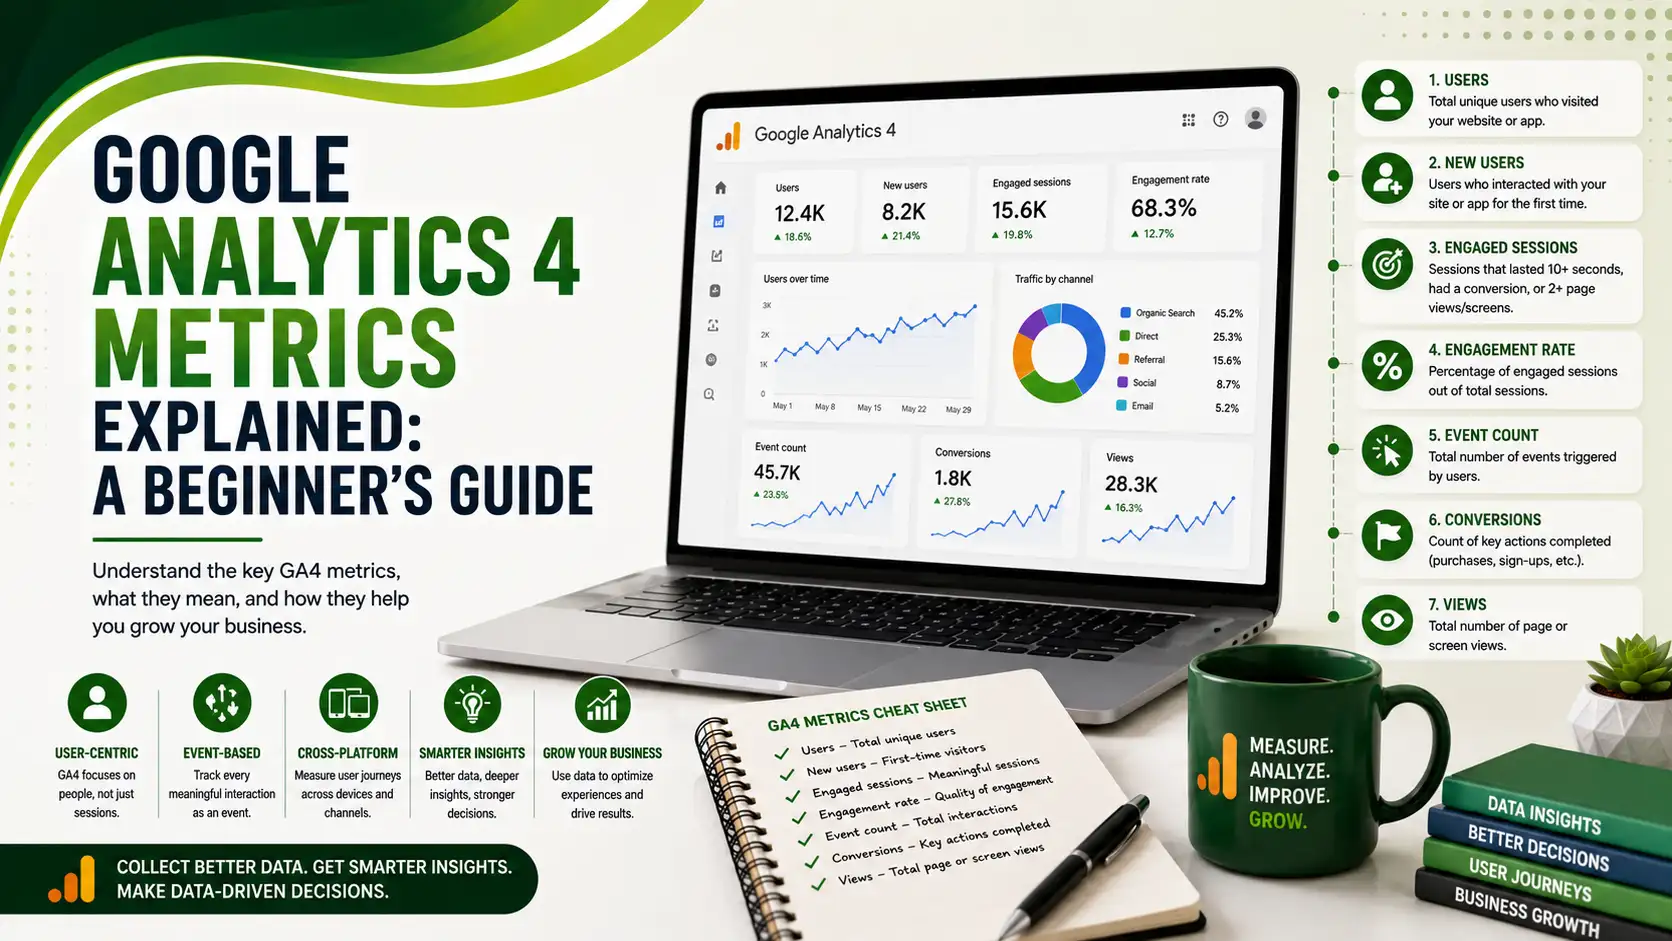
Google Analytics 4 metrics confuse people because GA4 quietly replaced bounce rate with engagement rate — a genuinely different way of measuring visits.
Table of Contents
ToggleGoogle Analytics 4 metrics confuse a lot of people at first, mostly because GA4 quietly replaced the metric everyone knew, bounce rate, with a new one, engagement rate, built on a completely different idea. Instead of asking "did they leave after one page," GA4 asks "did they actually do something meaningful while they were here."
01Google Analytics 4 Metrics Explained: The Big Shift
Google's own documentation defines the core idea plainly: the engagement rate is the percentage of engaged sessions on your website or app. The bounce rate is simply the opposite, the percentage of sessions that weren't engaged. If your engagement rate is 60%, your bounce rate is automatically 40%, they're mathematical mirrors of each other.
Semrush's guide explains the formula in the simplest possible terms: engagement rate equals the number of engaged sessions divided by the total number of sessions, times 100. If a site had 1,000 sessions and 546 met the engagement criteria, the engagement rate is 54.6%.
02What Makes a Session "Engaged"
Google's documentation, referenced above, defines an engaged session as any session that meets at least one of three conditions: it lasted 10 seconds or longer, it included a key event (GA4's term for a conversion), or it had two or more pageviews or screen views. Only one condition needs to be true, not all three.
Orbit Media's guide illustrates why this matters with a concrete comparison: a visitor who reads a 2,000-word article for four minutes and then closes the tab would have registered as a bounce under old Universal Analytics, since it was a single pageview. In GA4, that same visit counts as a fully engaged session, since it easily passed the 10-second threshold.
The 10-second threshold isn't fixed. KP Playbook's guide notes it's actually customizable inside your Data Streams settings, and can be extended up to 60 seconds if you want a stricter bar for what counts as genuine engagement on your specific site.
03Why You Can't Compare GA4 Bounce Rate to UA Bounce Rate
MB Advisory's guide is precise about a common, costly mistake: GA4 bounce rate is the percentage of sessions where the user spent fewer than 10 seconds, triggered no key event, and viewed fewer than two pages. Since the underlying definition is entirely different from Universal Analytics' single-pageview logic, a direct numerical comparison between a site's historical UA bounce rate and its GA4 bounce rate is invalid.
The practical takeaway: don't panic if your GA4 bounce rate looks dramatically lower than your old UA number, or celebrate too early either. You're not looking at an improvement or decline, you're looking at two genuinely different metrics measuring different things.
04Average Engagement Time: What's Actually Being Timed
Root & Branch Group's guide explains the mechanism behind this metric: GA4 records the time a page is actually in focus using an engagement_time_msec parameter, starting when a session begins and stopping the moment the user navigates away, closes the tab, or the page crashes. Background tabs don't count toward this figure.
This connects directly to our GA4 custom event tracking guide, since engagement time and key events both feed into the same underlying engaged-session logic covered here, understanding one makes the other far easier to configure correctly.
05A Quick Metrics Glossary
A short reference for the core engagement metrics you'll see across GA4 reports.
Engaged sessions: the raw count of sessions meeting at least one engagement condition.
Engagement rate: engaged sessions divided by total sessions, expressed as a percentage.
Average engagement time: the average time users actively spent with your page in focus.
Engaged sessions per user: total engaged sessions divided by total users, useful for gauging repeat engagement.
Bounce rate: the mathematical inverse of engagement rate, non-engaged sessions as a percentage of total.
06Engagement Rate Benchmarks by Channel
SEO Stuff's 2026 guide offers rough benchmark ranges worth knowing, though these vary by industry and should be treated as directional, not exact targets.
| Traffic Source | Typical Engagement Rate | Why |
|---|---|---|
| Organic search | 65-80% | Users searched for something specific and found it |
| Direct / URL typed | 60-75% | Intentional visits, often returning users |
| 70-85% | Already-engaged contacts who opted in | |
| Paid search | 50-65% | Ad-prompted rather than user-initiated |
| Organic social | 30-50% | Low-intent, browsing-mode traffic |
| Display ads | 20-40% | Interruption-based, typically lowest engagement |
07Getting Started With Engagement Metrics
A short list for anyone new to reading GA4 reports.
Look at engagement rate first, it's the primary quality signal GA4 was designed around.
Never compare GA4 bounce rate to UA bounce rate, the underlying definitions are entirely different.
Compare engagement rate across channels, not raw traffic volume, higher traffic with falling engagement often signals the wrong audience.
Apply engagement rate to a session or source, not an individual page, in your reporting language.
Add engagement rate as a key metric on your GA4 home report so it's visible without extra clicks.
08Try It: Engagement Rate Calculator
Enter your session numbers to calculate the engagement rate yourself.
Engagement Rate Calculator
Enter your total and engaged session counts
09Common Questions
Engagement rate. Rather than tracking single-page exits, GA4 measures the percentage of sessions where a user spent 10+ seconds, triggered a key event, or viewed 2+ pages. Bounce rate still exists, but it's now simply the inverse of engagement rate.
Any session meeting at least one of three conditions: lasting 10 seconds or longer, triggering a key event (conversion), or including two or more pageviews or screen views. Only one condition needs to be true.
No. The two metrics use fundamentally different definitions, UA counted single-pageview visits as bounces, GA4 factors in time spent and key events too. A direct numerical comparison between the two is invalid.
No, it's customizable in your Data Streams settings and can be extended up to 60 seconds if you want a stricter bar for what qualifies as meaningful engagement on your site.
It varies significantly by traffic source and industry. Organic search commonly ranges 65-80%, while display ads often sit at 20-40%. Compare your own numbers against your historical baseline and by channel, rather than a single universal target.
Related Articles
What We Learn Today
GA4 replaced bounce rate with the more meaningful engagement rate
A session is engaged if it meets just one of three conditions
GA4 and UA bounce rates can't be directly compared
The 10-second engagement threshold is customizable up to 60 seconds
Average engagement time only counts when the page is actively in focus
Engagement rate benchmarks vary widely by traffic channel
Build a Complete GA4 Foundation
Engagement metrics pair directly with events and conversions tracking. Explore both guides next.
Related Posts

Previous Post
Next Post
Previous Post

Next Post





- Artificial Intelligence
- Content
- Core Web Vitals
- Development
- Digital Marketing
- Display Advertising
- Google Ads
- Google Search Console
- GTM
- HTML
- HTML CSS
- JavaScript
- Keyword Research
- Link Building
- LinkedIn Ads
- Local SEO
- Meta Ads
- Mobile SEO
- Off-Page SEO
- On-Page SEO
- Paid Media
- Paid Media Analytics
- PHP
- PPC Strategy
- Python
- SEO
- SEO Basics
- SEO Tools
- Social
- Technical SEO