
Now Reading: GTM Preview Mode: 7 Pro Debugging Tips
-
01
GTM Preview Mode: 7 Pro Debugging Tips

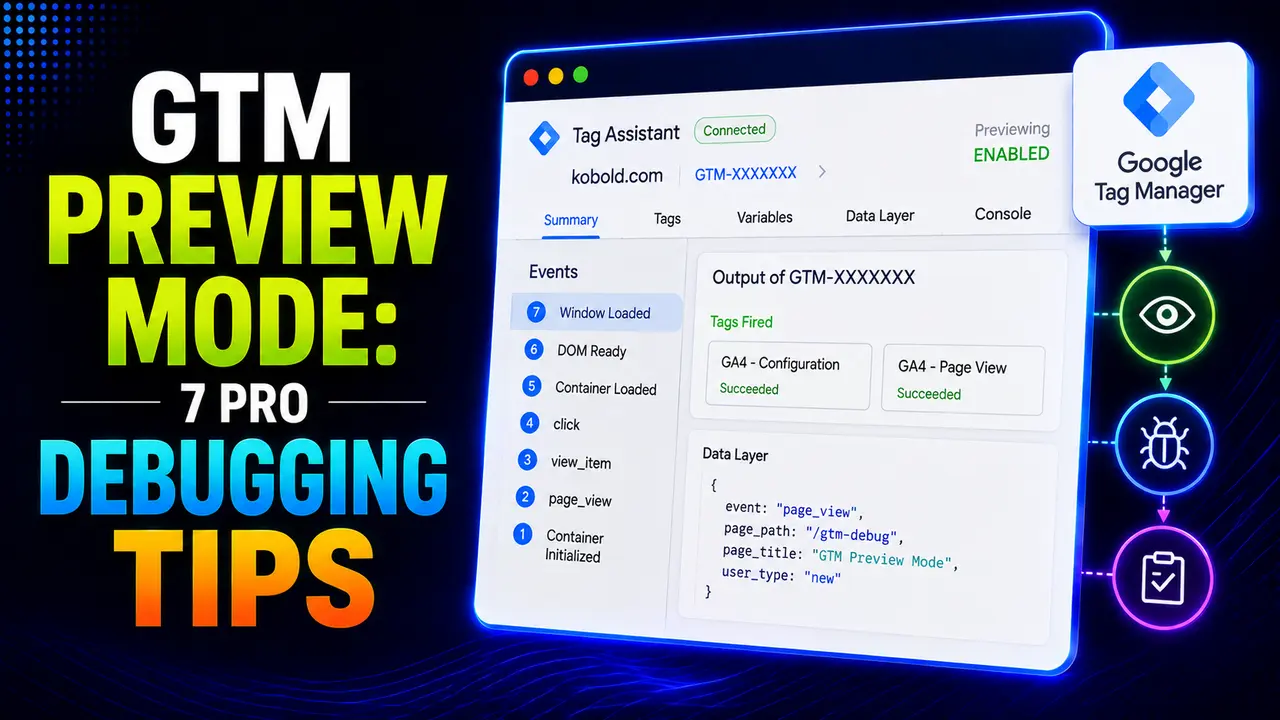
Most GTM preview mode confusion isn't a bug, it's reading the debugger wrong. Here's the event timeline mistake, the case-sensitivity trap, and the connection gotchas, each proven with real code.
Hey! If you've ever stared at a tag marked "Not Fired" with no idea why, or watched a variable come back empty for no obvious reason, this one's for you.
GTM preview mode is the closest thing Tag Manager gives you to seeing straight through the page, a real, live look at exactly what fires, what doesn't, and why, before any of it goes anywhere near your actual visitors. Most of the confusion people run into isn't a GTM bug at all, it's reading the debugger itself the wrong way, and that's exactly what this guide walks through with real, working proof.
What Is GTM Preview Mode and How Does It Actually Connect?
Per Google's own reference on previewing and debugging containers, starting a preview session opens a real debug interface that only appears in the same browser that started it, connected to your live site through a real background connection rather than anything installed on the page itself.
That connection genuinely depends on cookies. Stape's own preview mode guide confirms it plainly: a browser that blocks cookies set by other domains will simply fail to connect, which is exactly why GTM preview mode can work perfectly on one browser and refuse to connect at all on another, entirely unrelated to whether your GTM setup is actually correct.
Everything in this guide covers the standard web container's own debug interface, the one that runs directly in your browser. A container running through a real server uses a separate debugging setup instead, per Google's own server container debug documentation, worth knowing about upfront so you're not hunting for the same panel in the wrong place if your own tracking setup runs tagging through a server rather than only the browser.
Both versions exist for a real reason: a setup that runs entirely in the browser is simpler to debug directly, since preview mode can watch everything happen live in the same tab, while a server container adds a genuine extra hop that needs its own separate window and its own separate real connection to inspect.
Tip
New to Tag Manager itself? Our beginner's guide to GTM covers containers and workspaces before you get here.
Reading the GTM Preview Mode Event Timeline
Analytics Mania's own complete guide to the debug panel lays out what every page load records on the left side of the screen: real, chronological data layer events, typically Consent Initialization, Initialization, Container Loaded, DOM Ready, and Window Loaded, before any custom event like a click or a form submit ever shows up.
Each one of those events is a separate real snapshot, and clicking a different event in that timeline changes what the rest of the panel shows, which is the single most important habit to build before trying to debug anything else in GTM preview mode.
Custom events work exactly the same way. A click, a form submission, a scroll threshold, or a manual dataLayer.push() from your own code each add a new real entry to that same timeline, in the exact order they actually happened, right alongside the five standard events every page load starts with.
Consent Initialization deserves a specific mention, since it's the one event most people skip past without reading. It's where GTM records the real default consent state your own site set before any tag had a chance to fire, and checking it directly is the fastest way to confirm a Consent Mode default is actually being applied the way you configured it, rather than guessing from the tags that did or didn't fire afterward.
One independent debugger walkthrough notes that preview mode events stay recorded even when you navigate to a new page, so a checkout flow spanning several pages can still be debugged as one continuous timeline instead of losing everything on each reload.
The Single Biggest GTM Preview Mode Mistake
Analytics Mania's own guide states this directly, as one of the most common real mistakes: never inspect an individual tag while Summary is still selected above the event timeline. Always click the actual event first, then click into the tag or variable from there.
Here's exactly why that matters, proven against a real click event in a real browser, reading the same variable at two different points in a real, recorded timeline.

Read too early, at gtm.dom instead of the actual click event, and the variable simply isn't populated yet.

The exact same variable, read at the real gtm.click event, resolves correctly.
Nothing about the setup changed between those two reads, only which event in the real timeline was selected. A variable tied to a click, a form submission, or a scroll threshold simply doesn't exist yet on any earlier event, no matter how correctly it's configured.
Case Sensitive Variables: A Second Real GTM Preview Mode Trap
Stape's own guide flags a second real trap worth checking directly in the Variables tab: a Data Layer Variable's name has to match the pushed key exactly, case included. Here's that exact resolution logic proven with real code, mirroring how GTM's own variable resolution genuinely works.
resolveVariable(state, 'userId')
// -> '48213', the real pushed value

resolveVariable(state, 'userID')
// -> undefined, wrong case, same real data layer

resolveVariable(laterState, 'userId')
// -> '48213', still resolves two events later
To a human, userId and userID look close enough to be the same field. To GTM's real variable resolution, they're two completely different keys, and a variable configured with the wrong one will sit at undefined forever, with no error anywhere to point at the actual cause. GTM preview mode is exactly where this gets caught, since the Data Layer tab shows the real pushed key spelled exactly as your own code actually sent it, right next to the variable that's failing to read it.
Tags Fired vs Tags Not Fired: Reading the Real Reason
Clicking into a tag under Tags Not Fired shows its actual trigger conditions with a pass or fail mark next to each one, not just a blanket "didn't fire." Optimize Smart's own debugger tutorial recommends switching the Variables panel to its Values view specifically to compare what a trigger expected against what the page actually sent, since a tag that "was supposed to fire on gtm.click" but never did is often waiting on a completely different real event name.
Stape's guide also flags the reverse problem: a tag firing more than once for what looks like a single real action, often because two separate triggers both match the same event, or the page itself is pushing a duplicate event without anyone noticing. Catching that pattern is one of the real, practical reasons preview mode earns its place as the default way to sanity check a container before publishing it.
The debug panel's own Errors tab is worth a habitual glance too, separate from the Tags Not Fired list. It surfaces real tag template failures, a genuine JavaScript error thrown inside a custom template or a custom HTML tag, that a trigger evaluating cleanly would otherwise hide completely, since a trigger passing its own conditions says nothing about whether the tag it fired actually ran without crashing.
When GTM Preview Mode Won't Connect At All
Safari is the browser this breaks on most often. Simo Ahava's own real writeup traces the exact cause: Safari's Intelligent Tracking Prevention blocks the third party cookie that carries the preview session's authentication token on googletagmanager.com, so the real draft container version never reaches the page at all, and the fix is disabling cross site tracking protection for that test session specifically.
A dedicated troubleshooting guide covers the rest of the usual suspects when a real connection still won't establish: an ad blocker or privacy extension interfering, a stale session left open from an earlier debugging pass, or simply forgetting the site itself needs to be reloaded after a GTM change before preview mode reflects it.
One GTM tips and tricks writeup points out that debug mode isn't available for every container type at all, mobile app and AMP containers among them, per Google's own documentation, so a missing debug interface there is expected, not broken. Ruling that out first can save a genuinely frustrating hour spent troubleshooting a GTM preview mode connection that was never going to appear in the first place.
Common Pitfalls When You Use GTM Preview Mode
For the tag sequencing and setup issues that come up most often once preview mode reveals them, common GTM mistakes that break your tracking and the GTM data layer guide are worth reading alongside this one. And the rest of this series covers button clicks, outbound link clicks, and enhanced conversions setup for the rest of a genuinely complete tracking build.
Most often it's the wrong event selected in the timeline, or a case mismatch between the variable's configured key and the real pushed key. Both are covered with real proof above.
Usually blocked third party cookies, Safari's Intelligent Tracking Prevention being the single most common real cause, followed by ad blockers and stale sessions.
No. Select the real event in the timeline first, then inspect the tag from there, otherwise you're looking at the wrong moment in the data layer's real state.
No, mobile app and AMP containers don't support it, so a missing debug interface there is expected behavior, not a broken setup.
Yes, an open session can keep showing results from before your latest change, so refresh the preview after publishing or saving a new version.
Learn Today
Event Timeline
The real, chronological list of data layer events shown on the left of the debug panel.
Tags Not Fired
The panel listing tags whose trigger conditions didn't pass on the selected event.
Data Layer Variable
A variable resolved by an exact, case sensitive key lookup against the current merged state.
Third Party Cookie
The mechanism preview mode's own live connection genuinely depends on to work at all.
Summary View
An overview screen that should never be used to debug an individual tag directly.
Stale Session
An open preview connection still showing results from before the latest GTM change.
Ready to Build Cleaner Tracking?
Explore more Brandella Journal guides on tracking, analytics, and tag management.