Search Console Device Filter Now Lets You Pick Multiple Devices
The Search Console device filter now supports multi-select, so you can combine mobile and tablet data in one view. What changed and 5 ways to use it today.


In this article
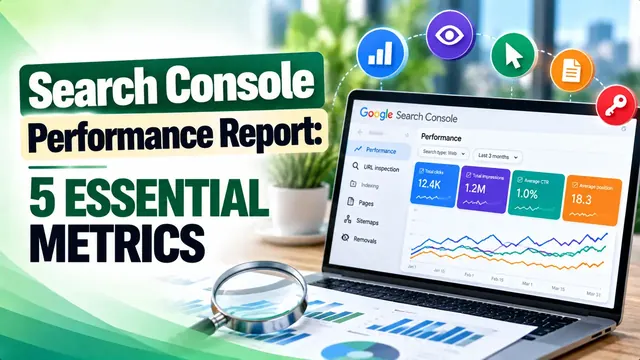
The Search Console device filter in the Performance report now lets you select more than one device at a time. Instead of choosing only Desktop, Mobile or Tablet, you can tick two of them and see their combined clicks, impressions, CTR and position in one view.
The change was spotted by Dan Richardson and confirmed by Barry Schwartz at Search Engine Roundtable on November 4, 2026. Google’s help page on Performance report filtering and comparison now states it directly: “Select multiple devices or countries to see their combined data.”
It is a small interface change, but it removes a common reporting chore. Anyone who has added mobile and tablet numbers together in a spreadsheet to get a “handheld” total can now do it inside Search Console.
What changed in the Search Console device filter
Until now the device filter worked like a single choice. To compare phones and tablets against desktop, you had to export each device separately and combine the rows yourself.
| Before | Now | |
|---|---|---|
| Device choices per filter | One device | One, two or all three devices |
| Combined mobile plus tablet totals | Manual export and spreadsheet math | Shown directly in the report |
| Works with other filters | Yes | Yes, for example query plus combined devices |
| Compare mode | Device vs device | Still available, one comparison at a time |
This follows the same update for countries. On October 6, 2026, Search Engine Roundtable reported that the country filter had gained multi-select, and Google said at the time it was updating filters “to make it easier for you to analyze traffic patterns across different countries and devices.” Devices have now caught up.
How multi-select works with other filters
Google’s help page explains a few rules worth knowing before you rely on the numbers.
- For countries and devices, selecting several values shows their combined data. For pages and queries, filters instead show data that matches or does not match your input.
- You can stack filters, for example a query filter plus a country filter plus a device filter.
- You cannot filter by multiple Search appearances at once.
- Filtering by query or page can change report totals, because of data truncation and anonymized queries that are left out.
- Only one comparison can be active at a time. Starting a new comparison replaces the old one.
If you need a refresher on what each metric means in this report, our guide to the Search Console performance report walks through clicks, impressions, CTR and position.
Five practical ways to use the device filter today
These are Brandella’s suggested workflows, not official Google instructions.
- Build a handheld view. Select Mobile and Tablet together, then compare the result against Desktop using Compare mode. This gives a cleaner picture of touch device performance, which matters because Google uses mobile first indexing.
- Find pages that lose on small screens. With Mobile and Tablet selected, sort the Pages tab by impressions and look for pages with a much lower CTR or position than on desktop. Those are candidates for a mobile UX review.
- Combine devices and countries in one pass. Select your main markets in the country filter and Mobile plus Tablet in the device filter. You now have one regional handheld report without any spreadsheet work.
- Check brand vs non brand by device. Add a query regex such as
(brandname|brand name)with “Doesn’t match regex” to remove branded searches, then apply the device filter. Our piece on the branded queries filter covers this in more detail. - Use weekly or monthly views for comparisons. Google’s help page suggests weekly or monthly granularity when comparing dates, which smooths out day of week swings that can hide device trends.
A note on recent click spikes
Some site owners have seen unusual click spikes in the Performance report in early November, as Search Engine Roundtable reported. Before you draw conclusions from a new device view, check whether a sudden jump appears on one device only, and compare it with your analytics data for the same days. A spike that shows up in Search Console but not in your site analytics deserves caution.
What to check if your reports look different
If your old device totals do not match a new combined view, a few things are worth checking.
- Totals vs sums. Report totals and the sum of table rows can differ because of data truncation and omitted queries. That was true before this change and still is.
- Date ranges. Make sure both views use the same dates and the same search type, such as Web, Image or Video.
- Exports and APIs. If you pull data with the API or a script, the API returns device as a separate dimension, so you combine devices yourself. Our tutorial on Search Console data pulls with Python shows how to group devices in code if you need the same handheld view in a dashboard.
- Looker Studio and other tools. Third party dashboards may not support multi-select in the same way. Check their device filters separately rather than assuming they match the Search Console interface.
Why this matters for SEO reporting
Device splits are one of the first things stakeholders ask about when traffic changes. Being able to answer “how are phones and tablets doing together?” inside Search Console, in seconds, makes routine reporting faster and reduces spreadsheet errors.
It also fits a pattern of steady improvements to the Performance report this year, including the experimental AI powered configuration for building filters from a plain language request. Open your Performance report, try a Mobile plus Tablet view against Desktop, and save the comparison you use most often for your monthly report.