
- Home
- SEODiscover the latest updates from across the United States, including politics, culture, economy, and trending stories. Stay informed on the key events shaping the nation and the topics everyone’s talking about.
- Technical SEOLearn technical SEO concepts including crawling, indexing, XML sitemaps, robots.txt, canonical tags, site architecture, and website performance.
- Local SEOOptimize your business for local seo with Google Business Profile, local citations, reviews, maps, and location-based SEO.
- Mobile SEOImprove your website’s mobile seo performance with responsive design, mobile-first indexing, usability, and page speed optimization.
- On-Page SEOExplore on-page seo optimization techniques such as title tags, meta descriptions, headings, URLs, internal linking, and content optimization.
- Off-Page SEODiscover off-page SEO strategies such as backlinks, digital PR, brand mentions, outreach, and authority building.
- SEO ToolsExplore the best SEO tools for keyword research, technical audits, backlink analysis, rank tracking, and website optimization.
- Core Web VitalsLearn how to improve Core Web Vitals including LCP, INP, CLS, page speed, and overall user experience for better rankings.
- Keyword ResearchLearn how to find profitable keywords, analyze search intent, evaluate competition, and build effective keyword strategies.
- Link BuildingMaster ethical link building techniques, backlink analysis, outreach methods, guest posting, and authority growth strategies.
- Google Search ConsoleLearn how to use Google Search Console to monitor indexing, fix errors, analyze search performance, and improve SEO.
- SEO BasicsLearn the fundamentals of search engine optimization (SEO Basics), including how search engines work, SEO terminology, and beginner-friendly best practices.
- Paid Media
- Display AdvertisingLearn display advertising strategies, banner ads, audience targeting, remarketing, Google Display campaigns, and optimization techniques.
- Google AdsLearn Google Ads strategies, campaign setup, bidding, keywords, Performance Max, Search Ads, and optimization techniques.
- LinkedIn AdsLearn LinkedIn Ads strategies for B2B marketing, lead generation, audience targeting, campaign optimization, and paid social advertising.
- Meta AdsLearn Meta Ads strategies for Facebook and Instagram, including campaign setup, targeting, retargeting, and performance optimization.
- Paid Media AnalyticsLearn paid media analytics, including CPC, CTR, CPA, ROAS, conversion tracking, attribution, reporting, and campaign performance analysis.
- PPC StrategyLearn effective PPC strategies, campaign planning, bidding, keyword targeting, landing pages, conversion optimization, and more.
- ContentTransform your living spaces with inspiration, tips, and trends in interior design. From minimalist decor to bold statements, find ideas for every style and budget.
- Social
- Digital MarketingExplore stories and advice on living your best life. From personal growth to entertainment, dive into the latest in lifestyle trends and inspiration.
- Artificial IntelligenceStay informed about health and wellness with expert advice, fitness tips, and the latest medical breakthroughs. Your guide to a healthier and happier life.
- DevelopmentYou will find development related educational articles
- GTMLearn Google Tag Manager (GTM) with practical guides for tags, triggers, variables, tracking, conversions, and website analytics implementation.
- HTMLLearn HTML with simple tutorials, examples, tags, elements, attributes, and best practices for building modern web pages.
- HTML CSSLearn HTML CSS together with practical tutorials, examples, layouts, styling techniques, responsive design, and modern web development practices.
- HTML JSLearn HTML JS – JavaScript with practical tutorials and examples for adding interactivity, dynamic content, events, and functionality to web pages.
- JavaScriptExplore JavaScript tutorials, examples, concepts, and practical techniques for creating interactive and dynamic websites and web applications.
- PHPLearn PHP programming with practical tutorials, examples, functions, syntax, and web development techniques for beginners and developers.
- PythonLearn Python programming with practical tutorials, examples, syntax, functions, automation techniques, and useful programming concepts.
- Home
- SEODiscover the latest updates from across the United States, including politics, culture, economy, and trending stories. Stay informed on the key events shaping the nation and the topics everyone’s talking about.
- Technical SEOLearn technical SEO concepts including crawling, indexing, XML sitemaps, robots.txt, canonical tags, site architecture, and website performance.
- Local SEOOptimize your business for local seo with Google Business Profile, local citations, reviews, maps, and location-based SEO.
- Mobile SEOImprove your website’s mobile seo performance with responsive design, mobile-first indexing, usability, and page speed optimization.
- On-Page SEOExplore on-page seo optimization techniques such as title tags, meta descriptions, headings, URLs, internal linking, and content optimization.
- Off-Page SEODiscover off-page SEO strategies such as backlinks, digital PR, brand mentions, outreach, and authority building.
- SEO ToolsExplore the best SEO tools for keyword research, technical audits, backlink analysis, rank tracking, and website optimization.
- Core Web VitalsLearn how to improve Core Web Vitals including LCP, INP, CLS, page speed, and overall user experience for better rankings.
- Keyword ResearchLearn how to find profitable keywords, analyze search intent, evaluate competition, and build effective keyword strategies.
- Link BuildingMaster ethical link building techniques, backlink analysis, outreach methods, guest posting, and authority growth strategies.
- Google Search ConsoleLearn how to use Google Search Console to monitor indexing, fix errors, analyze search performance, and improve SEO.
- SEO BasicsLearn the fundamentals of search engine optimization (SEO Basics), including how search engines work, SEO terminology, and beginner-friendly best practices.
- Paid Media
- Display AdvertisingLearn display advertising strategies, banner ads, audience targeting, remarketing, Google Display campaigns, and optimization techniques.
- Google AdsLearn Google Ads strategies, campaign setup, bidding, keywords, Performance Max, Search Ads, and optimization techniques.
- LinkedIn AdsLearn LinkedIn Ads strategies for B2B marketing, lead generation, audience targeting, campaign optimization, and paid social advertising.
- Meta AdsLearn Meta Ads strategies for Facebook and Instagram, including campaign setup, targeting, retargeting, and performance optimization.
- Paid Media AnalyticsLearn paid media analytics, including CPC, CTR, CPA, ROAS, conversion tracking, attribution, reporting, and campaign performance analysis.
- PPC StrategyLearn effective PPC strategies, campaign planning, bidding, keyword targeting, landing pages, conversion optimization, and more.
- ContentTransform your living spaces with inspiration, tips, and trends in interior design. From minimalist decor to bold statements, find ideas for every style and budget.
- Social
- Digital MarketingExplore stories and advice on living your best life. From personal growth to entertainment, dive into the latest in lifestyle trends and inspiration.
- Artificial IntelligenceStay informed about health and wellness with expert advice, fitness tips, and the latest medical breakthroughs. Your guide to a healthier and happier life.
- DevelopmentYou will find development related educational articles
- GTMLearn Google Tag Manager (GTM) with practical guides for tags, triggers, variables, tracking, conversions, and website analytics implementation.
- HTMLLearn HTML with simple tutorials, examples, tags, elements, attributes, and best practices for building modern web pages.
- HTML CSSLearn HTML CSS together with practical tutorials, examples, layouts, styling techniques, responsive design, and modern web development practices.
- HTML JSLearn HTML JS – JavaScript with practical tutorials and examples for adding interactivity, dynamic content, events, and functionality to web pages.
- JavaScriptExplore JavaScript tutorials, examples, concepts, and practical techniques for creating interactive and dynamic websites and web applications.
- PHPLearn PHP programming with practical tutorials, examples, functions, syntax, and web development techniques for beginners and developers.
- PythonLearn Python programming with practical tutorials, examples, syntax, functions, automation techniques, and useful programming concepts.
Now Reading: Google Ads Quality Score Explained: How to Improve It
-
01
Google Ads Quality Score Explained: How to Improve It
- Home//
- SEO//Discover the latest updates from across the United States, including politics, culture, economy, and trending stories. Stay informed on the key events shaping the nation and the topics everyone’s talking about.
- Technical SEO//Learn technical SEO concepts including crawling, indexing, XML sitemaps, robots.txt, canonical tags, site architecture, and website performance.
- Local SEO//Optimize your business for local seo with Google Business Profile, local citations, reviews, maps, and location-based SEO.
- Mobile SEO//Improve your website’s mobile seo performance with responsive design, mobile-first indexing, usability, and page speed optimization.
- On-Page SEO//Explore on-page seo optimization techniques such as title tags, meta descriptions, headings, URLs, internal linking, and content optimization.
- Off-Page SEO//Discover off-page SEO strategies such as backlinks, digital PR, brand mentions, outreach, and authority building.
- SEO Tools//Explore the best SEO tools for keyword research, technical audits, backlink analysis, rank tracking, and website optimization.
- Core Web Vitals//Learn how to improve Core Web Vitals including LCP, INP, CLS, page speed, and overall user experience for better rankings.
- Keyword Research//Learn how to find profitable keywords, analyze search intent, evaluate competition, and build effective keyword strategies.
- Link Building//Master ethical link building techniques, backlink analysis, outreach methods, guest posting, and authority growth strategies.
- Google Search Console//Learn how to use Google Search Console to monitor indexing, fix errors, analyze search performance, and improve SEO.
- SEO Basics//Learn the fundamentals of search engine optimization (SEO Basics), including how search engines work, SEO terminology, and beginner-friendly best practices.
- Paid Media//
- Display Advertising//Learn display advertising strategies, banner ads, audience targeting, remarketing, Google Display campaigns, and optimization techniques.
- Google Ads//Learn Google Ads strategies, campaign setup, bidding, keywords, Performance Max, Search Ads, and optimization techniques.
- LinkedIn Ads//Learn LinkedIn Ads strategies for B2B marketing, lead generation, audience targeting, campaign optimization, and paid social advertising.
- Meta Ads//Learn Meta Ads strategies for Facebook and Instagram, including campaign setup, targeting, retargeting, and performance optimization.
- Paid Media Analytics//Learn paid media analytics, including CPC, CTR, CPA, ROAS, conversion tracking, attribution, reporting, and campaign performance analysis.
- PPC Strategy//Learn effective PPC strategies, campaign planning, bidding, keyword targeting, landing pages, conversion optimization, and more.
- Content//Transform your living spaces with inspiration, tips, and trends in interior design. From minimalist decor to bold statements, find ideas for every style and budget.
- Social//
- Digital Marketing//Explore stories and advice on living your best life. From personal growth to entertainment, dive into the latest in lifestyle trends and inspiration.
- Artificial Intelligence//Stay informed about health and wellness with expert advice, fitness tips, and the latest medical breakthroughs. Your guide to a healthier and happier life.
- Development//You will find development related educational articles
- GTM//Learn Google Tag Manager (GTM) with practical guides for tags, triggers, variables, tracking, conversions, and website analytics implementation.
- HTML//Learn HTML with simple tutorials, examples, tags, elements, attributes, and best practices for building modern web pages.
- HTML CSS//Learn HTML CSS together with practical tutorials, examples, layouts, styling techniques, responsive design, and modern web development practices.
- HTML JS//Learn HTML JS – JavaScript with practical tutorials and examples for adding interactivity, dynamic content, events, and functionality to web pages.
- JavaScript//Explore JavaScript tutorials, examples, concepts, and practical techniques for creating interactive and dynamic websites and web applications.
- PHP//Learn PHP programming with practical tutorials, examples, functions, syntax, and web development techniques for beginners and developers.
- Python//Learn Python programming with practical tutorials, examples, syntax, functions, automation techniques, and useful programming concepts.
- Home
- Paid Media
- Google Ads
- Google Ads Quality Score Explained: How to Improve It
Google Ads Quality Score Explained: How to Improve It

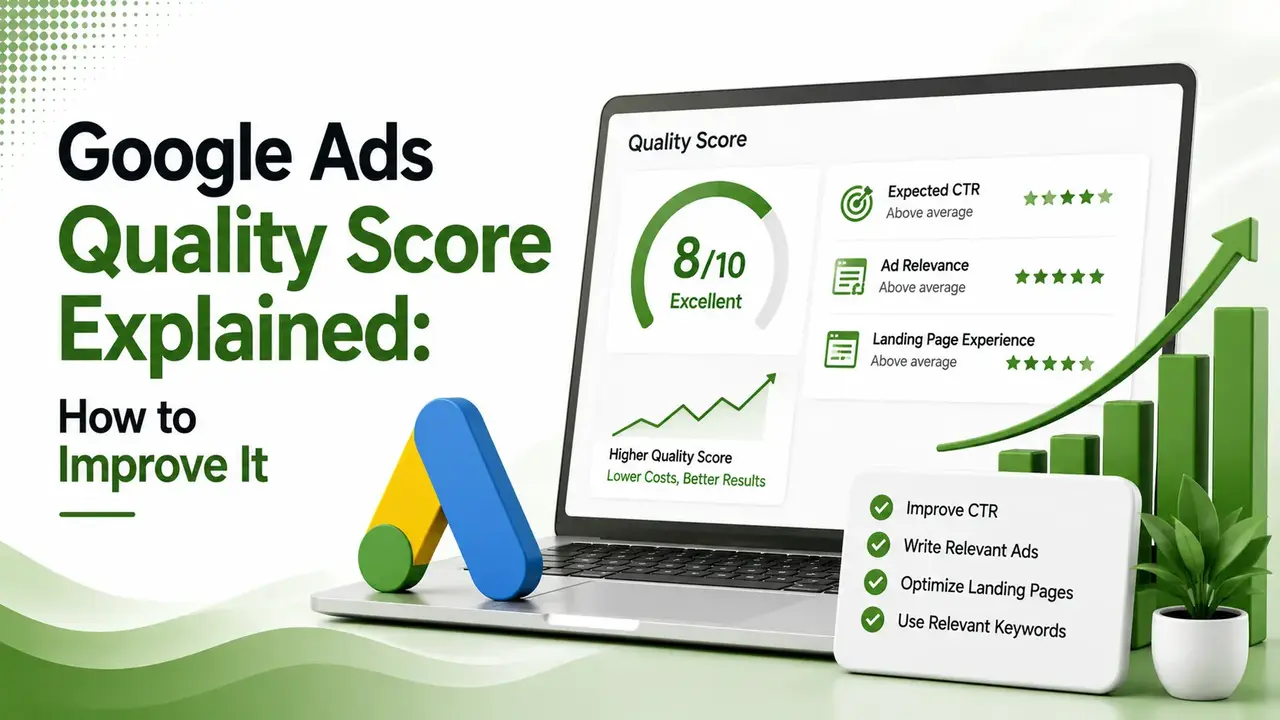
Quality Score quietly decides how much you pay per click and where your ad lands. Here's what the 1-10 score actually measures, the difference between your visible score and the real auction-time score, and the fastest ways to improve it.
Table of Contents
ToggleTwo advertisers bid on the same keyword. One pays $2 per click. The other pays $6. Same auction, same keyword, same budget available. The gap almost always comes down to one number sitting quietly in their dashboard: Quality Score. Here is what it actually measures, why it still matters in 2026, and the specific steps that move it.
Google Ads Quality Score is a rating from 1 to 10 that estimates the quality and relevance of your keyword, ad, and landing page compared to other advertisers targeting the same search.
A higher score signals to Google that your ad delivers a genuinely relevant experience, and Google rewards that with a lower cost per click and better ad placement.
We touched on the automation side of Google Ads in our piece on Google's updated Ads terms of service.
Quality Score sits underneath all of that automation, since even the smartest bidding strategy still has to compete in an auction where relevance quietly decides your final price.
is the scale Google Ads uses to rate keyword-level Quality Score in your dashboard
components make up the visible score: expected CTR, ad relevance, landing page experience
higher cost per click reported on the same keyword sitting at a low score versus a strong one
What Google Ads Quality-Score Actually Measures
The visible score in your dashboard breaks down into exactly three components, each rated below average, average, or above average.
Expected CTR
Ad Relevance
Landing Page Experience
Quality Score Bands: What Each Range Actually Means
Investigate
Average
Strong
The Visible Score vs. the Real Auction-Time Score
This distinction trips up even experienced advertisers, and it is worth understanding clearly.
Video: "Quality Score Explained: The Truth About Ad Rank and Ad Quality" by Jyll Saskin Gales, Inside Google Ads — credit to the original creator, via YouTube
According to Adalysis' Quality Score guide, the number you see in your account is technically a diagnostic estimate.
A separate, real-time Quality-Score gets calculated fresh in every single auction and feeds directly into Ad Rank.
That live number is never displayed anywhere in your dashboard. Improving your visible score reliably improves the underlying auction-time score too, so it remains the right thing to optimize.
Five Ways to Actually Improve Your Quality Score
Tighten Your Keyword Match Types
According to Store Growers' 2026 Quality Score guide, low expected CTR is often caused by ads showing for search queries that are not actually closely related to your keywords, which broad or loosely matched keywords make worse.
Use Negative Keywords Aggressively
Negative keywords do not directly touch Quality Score, but removing irrelevant, low-converting traffic lifts your overall CTR, which indirectly pulls the score up over time.
Write Ad Copy for Semantic Relevance, Not Just Keyword Matching
According to Twosquares' 2026 Quality-Score guide, Google's systems now understand semantic relevance well enough that closely related phrasing, not exact keyword repetition, can register as highly relevant.
Make the Landing Page Match the Ad's Promise Exactly
A landing page should directly answer the specific problem implied by the keyword, not send traffic to a generic homepage. Mismatched intent between ad and page is one of the most common sources of a weak landing page experience score.
Fix the Technical Side of the Landing Page Too
According to Twosquares' guide referenced above, Google now weighs engagement and technical signals, including page load speed and mobile usability, not just text relevance, when scoring landing page experience.
Does Updating My Ads Instantly Reset the Quality Score?
Not quite, and the timing here matters for how you plan improvements. Tap through both scenarios.
According to Groas' 2026 Quality Score playbook, Quality Score is calculated at the keyword level, not the ad level. Updating your ad copy does not instantly reset or refresh the keyword's existing score.
The keyword retains its historical score until enough new performance data accumulates against the updated ads. Improved copy that genuinely lifts expected CTR and relevance gradually pulls the score up over time, which is why continuous testing matters more than a single one-time refresh.
Quality Score Components Compared
| Component | What It Measures | Fastest Fix |
|---|---|---|
| Expected CTR | How likely your ad is to be clicked, relative to competitors | Tighter keyword match types, negative keywords |
| Ad Relevance | How closely ad copy matches the search query's intent | Ad copy aligned to semantic intent, not just keywords |
| Landing Page Experience | How useful and relevant the destination page is | Page content matches the keyword's specific problem |
How to Check Your Quality-Score in Google Ads
Open the Keywords view inside your campaign, then use the column customization menu to add the Quality Score column along with its three sub-component columns: expected CTR, ad relevance, and landing page experience.
According to Factors' 2026 Quality-Score analysis guide, viewing all three sub-components side by side, not just the overall number, is what actually tells you which specific factor needs attention rather than leaving you guessing.
Is Quality Score Still Worth Tracking in 2026?
According to Smarketa's 2026 Quality Score guide, Google has gradually downplayed the metric in its own public messaging, pushing advertisers toward automated bidding and broader targeting instead.
Despite that shift, the underlying mechanics have not changed. A keyword sitting at a low score can still cost several times more per click than the same keyword at a strong score, and that gap compounds across hundreds or thousands of clicks a month.
According to DigiGrowth Lab's 2026 Quality-Score guide, a well-structured account built around genuine relevance can still outperform competitors spending significantly more, since Google continues to reward relevance over raw bid size.
Does Quality Score Vary Across Different Levels of Your Account?
Quality Score is calculated at the keyword level, but it does not exist in isolation from the rest of your account structure.
An ad group stuffed with loosely related keywords sharing the same ad copy tends to produce a mix of strong and weak scores, since the ad cannot be equally relevant to every keyword in the group.
Tightly themed ad groups, where every keyword shares nearly identical intent, make it far easier for a single piece of ad copy to score well across the board.
This is why account structure work, splitting broad ad groups into narrower, more tightly themed ones, is often the highest-leverage Quality Score fix available, even though it never appears explicitly labeled as a "Quality Score fix" in Google's own interface.
Quality Score Across Different Campaign Types
Quality Score, in its classic 1-to-10 form, applies specifically to Search campaigns, where keyword and query matching drive the whole system.
Performance Max and Display campaigns work differently, since Google assembles ads from a pool of assets you provide rather than matching a specific keyword to a specific ad.
For these campaign types, the practical equivalent of improving Quality Score is making sure your asset groups, headlines, descriptions, and images closely match the audience segment you are targeting, since that alignment is what actually drives a stronger effective CTR in these automated formats.
FAQs on Google Ads Quality Score
Related Articles
What We Learn Today
Quality Score rates keywords from 1 to 10 based on relevance and expected performance.
Three components make it up: expected CTR, ad relevance, landing page experience.
A low score can cost several times more per click than a strong one.
The visible score is a diagnostic; a separate real score runs in every auction.
Updating ads does not instantly reset a keyword's historical score.
Relevance still beats raw bid size, even in an increasingly automated auction.
Related Posts
Previous Post
Next Post
Previous Post
Next Post


- Artificial Intelligence
- Content
- Core Web Vitals
- Development
- Digital Marketing
- Google Ads
- Google Search Console
- GTM
- HTML
- HTML CSS
- JavaScript
- Keyword Research
- Link Building
- Local SEO
- Meta Ads
- Mobile SEO
- Off-Page SEO
- On-Page SEO
- Paid Media
- Paid Media Analytics
- PHP
- PPC Strategy
- Python
- SEO
- SEO Basics
- SEO Tools
- Social
- Technical SEO