
- Home
- SEODiscover the latest updates from across the United States, including politics, culture, economy, and trending stories. Stay informed on the key events shaping the nation and the topics everyone’s talking about.
- Technical SEOLearn technical SEO concepts including crawling, indexing, XML sitemaps, robots.txt, canonical tags, site architecture, and website performance.
- Local SEOOptimize your business for local seo with Google Business Profile, local citations, reviews, maps, and location-based SEO.
- Mobile SEOImprove your website’s mobile seo performance with responsive design, mobile-first indexing, usability, and page speed optimization.
- On-Page SEOExplore on-page seo optimization techniques such as title tags, meta descriptions, headings, URLs, internal linking, and content optimization.
- Off-Page SEODiscover off-page SEO strategies such as backlinks, digital PR, brand mentions, outreach, and authority building.
- SEO ToolsExplore the best SEO tools for keyword research, technical audits, backlink analysis, rank tracking, and website optimization.
- Core Web VitalsLearn how to improve Core Web Vitals including LCP, INP, CLS, page speed, and overall user experience for better rankings.
- Keyword ResearchLearn how to find profitable keywords, analyze search intent, evaluate competition, and build effective keyword strategies.
- Link BuildingMaster ethical link building techniques, backlink analysis, outreach methods, guest posting, and authority growth strategies.
- Google Search ConsoleLearn how to use Google Search Console to monitor indexing, fix errors, analyze search performance, and improve SEO.
- SEO BasicsLearn the fundamentals of search engine optimization (SEO Basics), including how search engines work, SEO terminology, and beginner-friendly best practices.
- Paid Media
- Display AdvertisingLearn display advertising strategies, banner ads, audience targeting, remarketing, Google Display campaigns, and optimization techniques.
- Google AdsLearn Google Ads strategies, campaign setup, bidding, keywords, Performance Max, Search Ads, and optimization techniques.
- LinkedIn AdsLearn LinkedIn Ads strategies for B2B marketing, lead generation, audience targeting, campaign optimization, and paid social advertising.
- Meta AdsLearn Meta Ads strategies for Facebook and Instagram, including campaign setup, targeting, retargeting, and performance optimization.
- Paid Media AnalyticsLearn paid media analytics, including CPC, CTR, CPA, ROAS, conversion tracking, attribution, reporting, and campaign performance analysis.
- PPC StrategyLearn effective PPC strategies, campaign planning, bidding, keyword targeting, landing pages, conversion optimization, and more.
- ContentTransform your living spaces with inspiration, tips, and trends in interior design. From minimalist decor to bold statements, find ideas for every style and budget.
- Social
- Digital MarketingExplore stories and advice on living your best life. From personal growth to entertainment, dive into the latest in lifestyle trends and inspiration.
- Artificial IntelligenceStay informed about health and wellness with expert advice, fitness tips, and the latest medical breakthroughs. Your guide to a healthier and happier life.
- DevelopmentYou will find development related educational articles
- GTMLearn Google Tag Manager (GTM) with practical guides for tags, triggers, variables, tracking, conversions, and website analytics implementation.
- HTMLLearn HTML with simple tutorials, examples, tags, elements, attributes, and best practices for building modern web pages.
- HTML CSSLearn HTML CSS together with practical tutorials, examples, layouts, styling techniques, responsive design, and modern web development practices.
- HTML JSLearn HTML JS – JavaScript with practical tutorials and examples for adding interactivity, dynamic content, events, and functionality to web pages.
- JavaScriptExplore JavaScript tutorials, examples, concepts, and practical techniques for creating interactive and dynamic websites and web applications.
- PHPLearn PHP programming with practical tutorials, examples, functions, syntax, and web development techniques for beginners and developers.
- PythonLearn Python programming with practical tutorials, examples, syntax, functions, automation techniques, and useful programming concepts.
- Home
- SEODiscover the latest updates from across the United States, including politics, culture, economy, and trending stories. Stay informed on the key events shaping the nation and the topics everyone’s talking about.
- Technical SEOLearn technical SEO concepts including crawling, indexing, XML sitemaps, robots.txt, canonical tags, site architecture, and website performance.
- Local SEOOptimize your business for local seo with Google Business Profile, local citations, reviews, maps, and location-based SEO.
- Mobile SEOImprove your website’s mobile seo performance with responsive design, mobile-first indexing, usability, and page speed optimization.
- On-Page SEOExplore on-page seo optimization techniques such as title tags, meta descriptions, headings, URLs, internal linking, and content optimization.
- Off-Page SEODiscover off-page SEO strategies such as backlinks, digital PR, brand mentions, outreach, and authority building.
- SEO ToolsExplore the best SEO tools for keyword research, technical audits, backlink analysis, rank tracking, and website optimization.
- Core Web VitalsLearn how to improve Core Web Vitals including LCP, INP, CLS, page speed, and overall user experience for better rankings.
- Keyword ResearchLearn how to find profitable keywords, analyze search intent, evaluate competition, and build effective keyword strategies.
- Link BuildingMaster ethical link building techniques, backlink analysis, outreach methods, guest posting, and authority growth strategies.
- Google Search ConsoleLearn how to use Google Search Console to monitor indexing, fix errors, analyze search performance, and improve SEO.
- SEO BasicsLearn the fundamentals of search engine optimization (SEO Basics), including how search engines work, SEO terminology, and beginner-friendly best practices.
- Paid Media
- Display AdvertisingLearn display advertising strategies, banner ads, audience targeting, remarketing, Google Display campaigns, and optimization techniques.
- Google AdsLearn Google Ads strategies, campaign setup, bidding, keywords, Performance Max, Search Ads, and optimization techniques.
- LinkedIn AdsLearn LinkedIn Ads strategies for B2B marketing, lead generation, audience targeting, campaign optimization, and paid social advertising.
- Meta AdsLearn Meta Ads strategies for Facebook and Instagram, including campaign setup, targeting, retargeting, and performance optimization.
- Paid Media AnalyticsLearn paid media analytics, including CPC, CTR, CPA, ROAS, conversion tracking, attribution, reporting, and campaign performance analysis.
- PPC StrategyLearn effective PPC strategies, campaign planning, bidding, keyword targeting, landing pages, conversion optimization, and more.
- ContentTransform your living spaces with inspiration, tips, and trends in interior design. From minimalist decor to bold statements, find ideas for every style and budget.
- Social
- Digital MarketingExplore stories and advice on living your best life. From personal growth to entertainment, dive into the latest in lifestyle trends and inspiration.
- Artificial IntelligenceStay informed about health and wellness with expert advice, fitness tips, and the latest medical breakthroughs. Your guide to a healthier and happier life.
- DevelopmentYou will find development related educational articles
- GTMLearn Google Tag Manager (GTM) with practical guides for tags, triggers, variables, tracking, conversions, and website analytics implementation.
- HTMLLearn HTML with simple tutorials, examples, tags, elements, attributes, and best practices for building modern web pages.
- HTML CSSLearn HTML CSS together with practical tutorials, examples, layouts, styling techniques, responsive design, and modern web development practices.
- HTML JSLearn HTML JS – JavaScript with practical tutorials and examples for adding interactivity, dynamic content, events, and functionality to web pages.
- JavaScriptExplore JavaScript tutorials, examples, concepts, and practical techniques for creating interactive and dynamic websites and web applications.
- PHPLearn PHP programming with practical tutorials, examples, functions, syntax, and web development techniques for beginners and developers.
- PythonLearn Python programming with practical tutorials, examples, syntax, functions, automation techniques, and useful programming concepts.
Now Reading: Search Console Performance Report: 5 Essential Metrics
-
01
Search Console Performance Report: 5 Essential Metrics
- Home//
- SEO//Discover the latest updates from across the United States, including politics, culture, economy, and trending stories. Stay informed on the key events shaping the nation and the topics everyone’s talking about.
- Technical SEO//Learn technical SEO concepts including crawling, indexing, XML sitemaps, robots.txt, canonical tags, site architecture, and website performance.
- Local SEO//Optimize your business for local seo with Google Business Profile, local citations, reviews, maps, and location-based SEO.
- Mobile SEO//Improve your website’s mobile seo performance with responsive design, mobile-first indexing, usability, and page speed optimization.
- On-Page SEO//Explore on-page seo optimization techniques such as title tags, meta descriptions, headings, URLs, internal linking, and content optimization.
- Off-Page SEO//Discover off-page SEO strategies such as backlinks, digital PR, brand mentions, outreach, and authority building.
- SEO Tools//Explore the best SEO tools for keyword research, technical audits, backlink analysis, rank tracking, and website optimization.
- Core Web Vitals//Learn how to improve Core Web Vitals including LCP, INP, CLS, page speed, and overall user experience for better rankings.
- Keyword Research//Learn how to find profitable keywords, analyze search intent, evaluate competition, and build effective keyword strategies.
- Link Building//Master ethical link building techniques, backlink analysis, outreach methods, guest posting, and authority growth strategies.
- Google Search Console//Learn how to use Google Search Console to monitor indexing, fix errors, analyze search performance, and improve SEO.
- SEO Basics//Learn the fundamentals of search engine optimization (SEO Basics), including how search engines work, SEO terminology, and beginner-friendly best practices.
- Paid Media//
- Display Advertising//Learn display advertising strategies, banner ads, audience targeting, remarketing, Google Display campaigns, and optimization techniques.
- Google Ads//Learn Google Ads strategies, campaign setup, bidding, keywords, Performance Max, Search Ads, and optimization techniques.
- LinkedIn Ads//Learn LinkedIn Ads strategies for B2B marketing, lead generation, audience targeting, campaign optimization, and paid social advertising.
- Meta Ads//Learn Meta Ads strategies for Facebook and Instagram, including campaign setup, targeting, retargeting, and performance optimization.
- Paid Media Analytics//Learn paid media analytics, including CPC, CTR, CPA, ROAS, conversion tracking, attribution, reporting, and campaign performance analysis.
- PPC Strategy//Learn effective PPC strategies, campaign planning, bidding, keyword targeting, landing pages, conversion optimization, and more.
- Content//Transform your living spaces with inspiration, tips, and trends in interior design. From minimalist decor to bold statements, find ideas for every style and budget.
- Social//
- Digital Marketing//Explore stories and advice on living your best life. From personal growth to entertainment, dive into the latest in lifestyle trends and inspiration.
- Artificial Intelligence//Stay informed about health and wellness with expert advice, fitness tips, and the latest medical breakthroughs. Your guide to a healthier and happier life.
- Development//You will find development related educational articles
- GTM//Learn Google Tag Manager (GTM) with practical guides for tags, triggers, variables, tracking, conversions, and website analytics implementation.
- HTML//Learn HTML with simple tutorials, examples, tags, elements, attributes, and best practices for building modern web pages.
- HTML CSS//Learn HTML CSS together with practical tutorials, examples, layouts, styling techniques, responsive design, and modern web development practices.
- HTML JS//Learn HTML JS – JavaScript with practical tutorials and examples for adding interactivity, dynamic content, events, and functionality to web pages.
- JavaScript//Explore JavaScript tutorials, examples, concepts, and practical techniques for creating interactive and dynamic websites and web applications.
- PHP//Learn PHP programming with practical tutorials, examples, functions, syntax, and web development techniques for beginners and developers.
- Python//Learn Python programming with practical tutorials, examples, syntax, functions, automation techniques, and useful programming concepts.
- Home
- SEO
- Google Search Console
- Search Console Performance Report: 5 Essential Metrics
Search Console Performance Report: 5 Essential Metrics

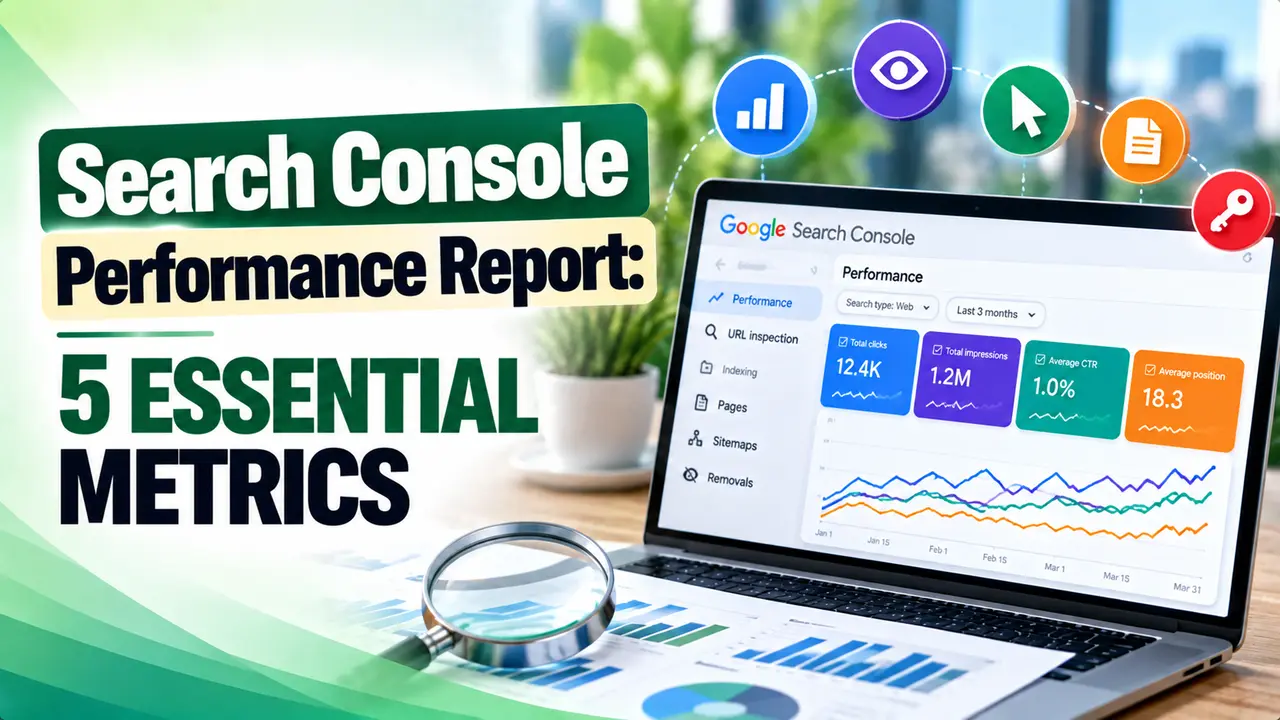
A page sitting quietly on page two, collecting impressions and almost no clicks, will never show up by scrolling your own site. This guide shows how to read a search console performance report, why average position can be misleading, and where the fastest ranking wins are usually hiding.
Table of Contents
ToggleHey! If you have ever stared at a spreadsheet of queries in Search Console and thought "okay, now what do I actually do with this," this one is for you. We are going to turn that raw table into a short list of pages you can fix this week.
Picture this: a page you wrote months ago is sitting on page two of Google, quietly collecting thousands of impressions and almost no clicks. You would never notice it by scrolling your own site. But a Search Console Performance Report would show it to you in about thirty seconds, if you know where to look.
What a Search Console Performance Report Actually Shows You
Open Search Console and click Performance in the left sidebar, and you land on the Search results view. This is the only place Google hands you real data about how people found your site in organic search, straight from its own logs rather than a third party estimate.
The Search Console Performance Report is built around one table and one chart, both of which respond live to whatever filters and date range you set at the top of the page. Every row in that table represents either a query, a page, a country, a device, or a search appearance type, depending on which tab you have selected.
Before you dig into the technique in this guide, it helps to have your property configured properly so the data you are reading is complete and accurate. Our guide to setting up Search Console walks through verification and sitemap submission if you have not done that yet.
Tip
Set your date range to the last twenty eight days for day to day monitoring, but switch to three or six months whenever you are hunting for quick wins. A short window hides patterns that only show up over time.
The Four Metrics Behind Every Number
Every row in the Performance report reduces down to four measurements, and Google defines them precisely rather than leaving them open to interpretation. Clicks are, in Google's own words, how often someone clicked a link from Google to your site. Impressions count how often a link to your site was seen in results, even if nobody scrolled far enough to notice it, according to Search Console Help.
Click through rate is simply clicks divided by impressions, expressed as a percentage, and average position is where your link typically sat on the results page, counted from the top down. None of these four numbers tells the full story on its own, which is exactly why the Search Console Performance Report pairs them together in one view.
| Metric | What It Measures | What To Watch For |
|---|---|---|
| Clicks | Visits that started from a Google result | Flat clicks despite rising impressions |
| Impressions | Times your link appeared, even unscrolled | High volume with little traffic to show |
| Click through rate | Clicks as a share of impressions | A rate far below the average for that position |
| Position | Average rank across all matching queries | Pages hovering just below the first page |
An analysis of roughly four million Google results found the top ranking page captures about 27.6 percent of all clicks for its query, and the top three results combine for over half of them, according to Backlinko.
Why a Good Position Does Not Always Mean Clicks
It is tempting to treat position as the only metric that matters, but click through rate can swing wildly between two pages sitting at the same spot. A benchmark study cited by Semrush puts average click through rate near 39.8 percent at position one, dropping to 18.7 percent at position two and 10.2 percent at position three, and the same research notes that only about 0.63 percent of searchers ever click something on page two at all.
The landscape has also shifted recently because of AI generated summaries appearing above the organic results. Ahrefs analyzed three hundred thousand keywords and found position one click through rate fell by roughly 34.5 percent when an AI Overview appeared on the page, and a separate study of seven hundred thousand keywords by Amsive found informational queries without a brand name lost around 20 percent of their clicks, as reported by Search Engine Land.
That shift matters for how you read your own Search Console Performance Report. A page that used to convert impressions into clicks reliably at position three might now show a lower click through rate simply because an AI summary sits above it, not because your content got worse.
The Position Four to Fifteen Opportunity
Here is the actual quick win technique at the center of this guide. Open the Queries tab in your Search Console Performance Report, sort the table by impressions from highest to lowest, and scan for rows with an average position somewhere between four and fifteen. Those queries already rank, Google already trusts the page enough to show it often, but it has not quite broken into the top three where most of the clicks land.
Search Engine Journal describes this group as striking distance keywords, originally defined as positions four through twenty, though the article notes the range is meant to be adjusted rather than treated as a fixed rule. A more recent playbook from GSC Wizard narrows the practical sweet spot to positions five through fifteen, arguing that pushing a page from position fifteen to position three is a far easier lift than pushing it from position five.
That same playbook recommends ignoring any query with fewer than fifty impressions across a ninety day window, since smaller samples are too noisy to act on with confidence. One worked example it cites shows a query sitting at a 1.3 percent click through rate despite thirty four hundred impressions in ninety days, which is exactly the kind of row worth your time.
Once you have your short list, cross check the surviving queries against your existing keyword research to confirm search intent before you touch the page. Our comparison of keyword research tools is a useful second opinion if a query looks promising but unfamiliar.
Tip
For each query in the four to fifteen range, open the matching page and check whether that exact phrase actually appears in the title tag, the first paragraph, and at least one heading. A Search Console Performance Report full of near misses, where the keyword is implied but never written out, is one of the easiest fixes you will find all month.
Stacking Query, Page, Country, and Device Filters
The dimension tabs along the top of the Search Console Performance Report, covering queries, pages, countries, devices, search appearance, and dates, are not meant to be used one at a time. According to Search Console Help, you can apply several filters together so the table only shows rows that match every condition at once.
A practical combination for the four to fifteen technique looks like this: filter to a single page, add a country filter for your main market, then switch to the Queries tab to see exactly which search terms are dragging that page's average position down. Flip to the Devices tab afterward, since a page that performs fine on desktop but badly on mobile often has a technical cause rather than a content one.
Before you act on any list of queries, filter out your own brand terms so they do not crowd out the generic opportunities you are actually looking for. Search Console has a built in way to do this, which our guide to the branded queries filter explains step by step, and a similar manual approach using combined filters is described by Resignal, which recommends a wide six month window when exporting data to spot topic patterns across many queries at once.
Common Mistakes People Make Reading the Report
Most of the confusion around this report comes from treating it like a ranking tracker instead of a log of real search behavior. It is neither wrong nor broken when a number looks odd, it is usually just being measured differently than you expect.
If a page is missing from the Search Console Performance Report entirely, that is an indexing question, not a performance question, and pulling it apart with filters will not help. Our walkthrough of the URL Inspection tool is the right next step for that specific problem.
What the Data Will Not Tell You
A Search Console Performance Report is honest but incomplete, and knowing its edges saves you from chasing phantom problems. Google retains this data for only sixteen months, after which older rows are permanently removed from the interface, as noted by SEO Testing.
The numbers you see are also not instant. Search Console itself warns of a lag between when activity happens and when it shows up in your account, and in practice that gap typically runs about two to three days, per the same source and Google's own About Search Console data documentation. Rows for very rare, low volume queries are also omitted from the table to protect searcher privacy, which mostly affects long tail terms rather than the mid volume rows this guide focuses on.
Pair the Performance report with your crawl data for a fuller picture, since a page can look fine in one and still have a problem the other would catch. Our guide to the Crawl Stats report covers the crawling side of that equation.
Tip
Export your Performance report data on a regular schedule, monthly works well, so you keep a running archive beyond the sixteen month window Search Console itself retains.
It shows real data on how your site appeared and performed in Google Search results, broken down by query, page, country, device, and date, so you can see which pages earn clicks and which ones only earn impressions.
Average position is calculated across every query and every search where your page appeared, so a page ranking first for a rare query and twentieth for a common one will show a blended middle number rather than either extreme.
The Performance report keeps roughly sixteen months of history. Anything older than that is deleted from the interface, so it is worth exporting your data periodically if you want a longer archive.
Look for queries with at least fifty impressions over a recent ninety day stretch, an average position between four and fifteen, and a click through rate noticeably below what similar positions typically earn. Those are the rows most likely to respond to a focused edit.
Features like AI generated summaries now sit above organic results for many informational queries and absorb a share of clicks that used to go to the top ranking pages, so a lower click through rate does not always mean your content declined.
Learn Today
Impression
A count of how often your link was shown in a search result, whether or not anyone noticed it.
Click Through Rate
Clicks divided by impressions, shown as a percentage, for a query, page, or any other dimension.
Average Position
The typical rank of your link across every matching search, counted from the top of the results down.
Striking Distance Keyword
A query ranking close enough to the first page that a small content edit can realistically push it higher.
Search Appearance
A dimension showing which special result types, such as rich results, your pages qualified for.
AI Overview
A generated summary Google can place above organic results for some queries, which can change click patterns.
Related Articles
Turn Your Performance Report Into a To Do List
Explore more Brandella Journal guides on SEO and digital marketing.
Related Posts
Previous Post
Next Post
Previous Post
Next Post



- Artificial Intelligence
- Content
- Core Web Vitals
- Development
- Digital Marketing
- Display Advertising
- Google Ads
- Google Search Console
- GTM
- HTML
- HTML CSS
- JavaScript
- Keyword Research
- Link Building
- LinkedIn Ads
- Local SEO
- Meta Ads
- Mobile SEO
- Off-Page SEO
- On-Page SEO
- Paid Media
- Paid Media Analytics
- PHP
- PPC Strategy
- Python
- SEO
- SEO Basics
- SEO Tools
- Social
- Technical SEO