
Now Reading: JavaScript Event Loop: 7 Things SEO and Marketing Developers Should Know
-
01
JavaScript Event Loop: 7 Things SEO and Marketing Developers Should Know
JavaScript Event Loop: 7 Things SEO and Marketing Developers Should Know

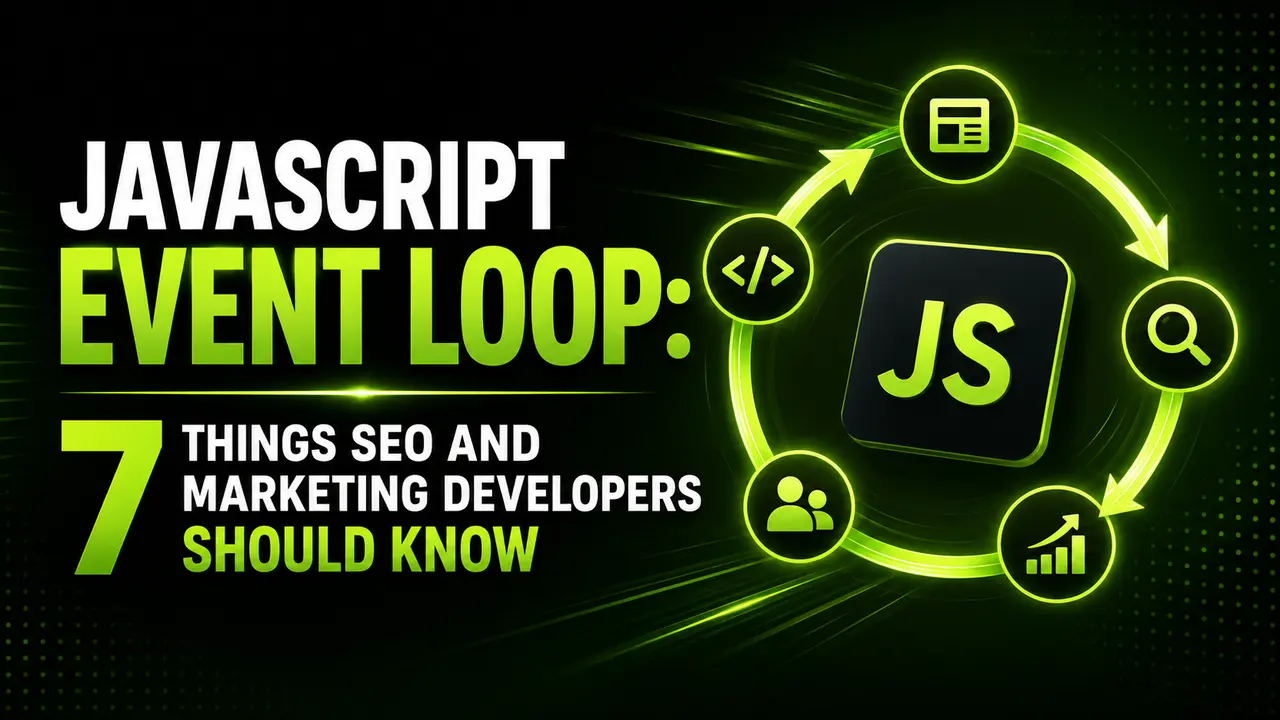
A practical look at the javascript event loop for SEO and marketing developers, with real timing captured to show why heavy tags block a page.
Ever pasted a tracking snippet into Google Tag Manager and watched the whole page stutter for a second? That is not bad luck. That is the javascript event loop, and once you can see how it actually schedules work, that stutter stops being a mystery.
JavaScript Event Loop: Why It Matters Even If You Never Write a Framework
You do not need to build a JavaScript application to be affected by this. Every GTM tag, every GA4 event snippet, every third party pixel you paste into a site runs through the exact same javascript event loop as a full blown app.
JavaScript can only do one thing at a time. That single sentence explains more slow, janky marketing pages than any other fact about how browsers work, and the rest of this guide is really just unpacking what "one thing at a time" means in practice.
The Call Stack: JavaScript Really Can Only Do One Thing at a Time
Every function call gets pushed onto a structure called the call stack, and JavaScript works through it one entry at a time, top to bottom, before it will look at anything else waiting in line.
As long as something is still running on that stack, nothing else gets a turn. Not a click handler, not a scroll listener, not a tag that is supposedly scheduled to fire in fifty milliseconds. The browser is busy, full stop.
Open Chrome DevTools' Performance panel and record a page load with a few marketing tags installed. Any solid colored bar longer than about 50 milliseconds on the main thread is a long task, and it is blocking everything else the exact way described above.
The full mechanics behind this, exactly how a browser interleaves the call stack, task queues, and rendering work, are documented formally in the WHATWG HTML event loop specification, the same document every browser vendor implements against. Reading even a portion of it makes the javascript event loop feel far less like folklore and much more like an actual, testable algorithm.
Microtasks vs Macrotasks: Why a Promise Jumps the Queue
Once the call stack empties out, the javascript event loop does not treat everything waiting in line equally. Promises and a few related APIs go into a microtask queue, and that entire queue always drains completely before the loop even glances at the next macrotask, the category setTimeout and DOM events both belong to.
console.log('1: sync - script start');

setTimeout(() => {
  console.log('4: macrotask - setTimeout callback');
}, 0);

Promise.resolve().then(() => {
  console.log('3: microtask - promise.then callback');
});

console.log('2: sync - script end');
Notice the setTimeout above asks for a delay of zero milliseconds. Reading the code top to bottom, you might expect it to run second. Running it for real tells a different story.

Actual output. Both synchronous lines run first, then the microtask, and the zero delay setTimeout still finishes last.
A setTimeout(fn, 0) call never actually means zero milliseconds. Browsers clamp it to a small positive minimum, and the callback still has to wait for the current call stack to clear and the entire microtask queue to drain first, both explained in MDN's setTimeout delay documentation.
V8, the JavaScript engine behind both Chrome and Node.js, has written in detail about how it optimizes microtask handling internally, worth a look once the basic javascript event loop ordering shown above feels familiar rather than surprising.
What Actually Happens When a setTimeout Callback Runs Late
The demo above used trivial functions, so the delay was barely noticeable. Swap in something closer to a real marketing script, a synchronous block of work that takes a few hundred milliseconds, and the same rule produces a very visible problem.
setTimeout(() => {
  trackingPixel();
}, 50);

// a real, genuinely blocking synchronous loop, not a simulated delay
const deadline = Date.now() + 300;
while (Date.now() < deadline) {
  // heavy synchronous analytics parsing happens here
}
The setTimeout above asked to run after 50 milliseconds. Below is what genuinely happened when that request had to wait behind 300 milliseconds of real, synchronous work already sitting on the call stack.

Actual output. A 50ms request turned into a 379ms wait, entirely because of what else was running on the call stack.
A requested delay on setTimeout is always a minimum, never a guarantee. Any synchronous work already queued ahead of it, including a heavy marketing tag parsing a large JSON payload, pushes the actual fire time later, sometimes by hundreds of milliseconds.
Why This Matters for GTM, GA4, and Third Party Marketing Tags
Every tag added through Google Tag Manager competes for the exact same single threaded call stack as the rest of the page. A container with a dozen tags, each doing its own synchronous parsing on load, adds up fast.
How a script tag itself gets loaded changes this picture too. MDN's script element reference covers the difference between a plain, an async, and a defer script tag in detail, and GTM's own loader already uses async by default for exactly this reason.
| Script Loading Method | Blocks Page Rendering? | Typical Use |
|---|---|---|
| Plain synchronous script tag | Yes, until it finishes downloading and running | Avoid for anything but critical inline setup |
| async script tag | No, but runs the moment it is ready, in any order | Independent tags, most tracking pixels |
| defer script tag | No, runs after parsing, in source order | Scripts that depend on the full DOM existing |
| Google Tag Manager container | No, loads async by default | Most marketing and analytics tags |
Setting up GTM's web container correctly, and reviewing GA4 event configuration through custom event tracking with Google Tag Manager, both help, but neither one rewrites how the underlying event loop schedules the work those tags trigger.
Google's own Tag Manager help center covers container and tag firing settings in more depth, though no amount of GTM configuration replaces actually understanding the javascript event loop the tags themselves run on underneath.
Event Loop Blocking Shows Up Directly in Core Web Vitals
The delayed setTimeout demonstrated earlier is not just a curiosity. That exact behavior, a long synchronous task holding the call stack hostage, is precisely what Total Blocking Time measures during a Lighthouse audit.
The same mechanism drives a poor Interaction to Next Paint score too. A click or a tap sits in the event queue behind whatever is still running, and the user feels every millisecond of that wait as unresponsiveness.
Chrome's own guidance on Interaction to Next Paint specifically recommends breaking long JavaScript tasks into smaller chunks and yielding back to the browser between them, using setTimeout or the newer scheduler.yield() API, so queued input events actually get a turn on the call stack.
Reading a full Core Web Vitals guide alongside this one connects the dots between the abstract mechanics here and the actual score reported in Search Console.
Practical Fixes: Yielding Back to the Browser on Purpose
Once the javascript event loop model clicks, most fixes become obvious. The goal is always the same: keep any single piece of synchronous work short enough that the browser can still respond to a real user in between, which is really the entire javascript event loop lesson in one sentence.
A scroll or resize handler tied to a marketing feature, like a sticky promotional banner or a scroll triggered popup, is a direct match for the debounce and throttle patterns covered in an earlier guide, both of which exist specifically to keep the call stack from filling up with redundant work.
Breaking a large synchronous loop into smaller chunks, each wrapped in its own setTimeout(fn, 0) call, forces a return trip through the macrotask queue between chunks, giving the browser a real chance to paint and respond to input along the way. Node.js's own event loop documentation covers the same underlying queue mechanics from the server side.
- Audit every GTM tag for synchronous work on load: a tag parsing a large payload before it fires blocks the same call stack as everything else on the page.
- Prefer async over plain script tags: a plain synchronous script tag stops the parser cold until it finishes.
- Debounce or throttle any scroll or input driven marketing script: a popup trigger or a sticky banner rarely needs to run on every single event.
- Break up long synchronous loops: yielding back to the browser between chunks keeps input responsive.
- Measure with the Performance panel, not assumptions: a long task bar longer than 50ms is worth investigating directly, tag by tag.
Frequently Asked Questions
It is the mechanism that lets single threaded JavaScript handle asynchronous work. It keeps checking whether the call stack is empty, and if it is, pulls the next waiting task, microtask first, then macrotask, onto the stack to run.
Because the tag's script is running synchronously on the same call stack as everything else. A heavy parsing step inside that tag blocks scrolling, clicking, and rendering until it finishes.
No. It still has to wait for the current call stack to clear and the microtask queue to drain first, and browsers also clamp the delay to a small positive minimum rather than truly zero.
A Promise callback is a microtask, and the entire microtask queue always finishes before the next macrotask, like a setTimeout callback or a DOM event, gets a turn.
A long synchronous task holding the call stack is exactly what Total Blocking Time measures, and it is the same reason a page can score poorly on Interaction to Next Paint even when it looks visually complete.
Partially. Choosing async loading, removing unnecessary tags, and consolidating trigger conditions in Google Tag Manager all help without writing code, though a genuinely heavy custom script usually still needs developer attention.
What We Learn Today
JavaScript runs one thing at a time
The call stack processes work in strict order.
Microtasks always run before macrotasks
Promises jump the queue ahead of setTimeout.
A requested delay is a minimum, not a guarantee
Proven above with a real 329ms overshoot.
Marketing tags share the same call stack
A heavy GTM tag blocks the rest of the page too.
Blocking shows up in Core Web Vitals
Directly measured by Total Blocking Time and INP.
Yielding back to the browser is the fix
Smaller chunks and async loading keep input responsive.
Ready to Stop Marketing Tags From Freezing Your Pages?
Understanding the javascript event loop turns a vague "the site feels slow" complaint into a specific, fixable list of tags and scripts worth auditing first.