
- Home
- SEODiscover the latest updates from across the United States, including politics, culture, economy, and trending stories. Stay informed on the key events shaping the nation and the topics everyone’s talking about.
- Technical SEOLearn technical SEO concepts including crawling, indexing, XML sitemaps, robots.txt, canonical tags, site architecture, and website performance.
- Local SEOOptimize your business for local seo with Google Business Profile, local citations, reviews, maps, and location-based SEO.
- Mobile SEOImprove your website’s mobile seo performance with responsive design, mobile-first indexing, usability, and page speed optimization.
- On-Page SEOExplore on-page seo optimization techniques such as title tags, meta descriptions, headings, URLs, internal linking, and content optimization.
- Off-Page SEODiscover off-page SEO strategies such as backlinks, digital PR, brand mentions, outreach, and authority building.
- SEO ToolsExplore the best SEO tools for keyword research, technical audits, backlink analysis, rank tracking, and website optimization.
- Core Web VitalsLearn how to improve Core Web Vitals including LCP, INP, CLS, page speed, and overall user experience for better rankings.
- Keyword ResearchLearn how to find profitable keywords, analyze search intent, evaluate competition, and build effective keyword strategies.
- Link BuildingMaster ethical link building techniques, backlink analysis, outreach methods, guest posting, and authority growth strategies.
- Google Search ConsoleLearn how to use Google Search Console to monitor indexing, fix errors, analyze search performance, and improve SEO.
- SEO BasicsLearn the fundamentals of search engine optimization (SEO Basics), including how search engines work, SEO terminology, and beginner-friendly best practices.
- Paid Media
- Display AdvertisingLearn display advertising strategies, banner ads, audience targeting, remarketing, Google Display campaigns, and optimization techniques.
- Google AdsLearn Google Ads strategies, campaign setup, bidding, keywords, Performance Max, Search Ads, and optimization techniques.
- LinkedIn AdsLearn LinkedIn Ads strategies for B2B marketing, lead generation, audience targeting, campaign optimization, and paid social advertising.
- Meta AdsLearn Meta Ads strategies for Facebook and Instagram, including campaign setup, targeting, retargeting, and performance optimization.
- Paid Media AnalyticsLearn paid media analytics, including CPC, CTR, CPA, ROAS, conversion tracking, attribution, reporting, and campaign performance analysis.
- PPC StrategyLearn effective PPC strategies, campaign planning, bidding, keyword targeting, landing pages, conversion optimization, and more.
- ContentTransform your living spaces with inspiration, tips, and trends in interior design. From minimalist decor to bold statements, find ideas for every style and budget.
- Social
- Digital MarketingExplore stories and advice on living your best life. From personal growth to entertainment, dive into the latest in lifestyle trends and inspiration.
- Artificial IntelligenceStay informed about health and wellness with expert advice, fitness tips, and the latest medical breakthroughs. Your guide to a healthier and happier life.
- DevelopmentYou will find development related educational articles
- GTMLearn Google Tag Manager (GTM) with practical guides for tags, triggers, variables, tracking, conversions, and website analytics implementation.
- HTMLLearn HTML with simple tutorials, examples, tags, elements, attributes, and best practices for building modern web pages.
- HTML CSSLearn HTML CSS together with practical tutorials, examples, layouts, styling techniques, responsive design, and modern web development practices.
- HTML JSLearn HTML JS – JavaScript with practical tutorials and examples for adding interactivity, dynamic content, events, and functionality to web pages.
- JavaScriptExplore JavaScript tutorials, examples, concepts, and practical techniques for creating interactive and dynamic websites and web applications.
- PHPLearn PHP programming with practical tutorials, examples, functions, syntax, and web development techniques for beginners and developers.
- PythonLearn Python programming with practical tutorials, examples, syntax, functions, automation techniques, and useful programming concepts.
- Home
- SEODiscover the latest updates from across the United States, including politics, culture, economy, and trending stories. Stay informed on the key events shaping the nation and the topics everyone’s talking about.
- Technical SEOLearn technical SEO concepts including crawling, indexing, XML sitemaps, robots.txt, canonical tags, site architecture, and website performance.
- Local SEOOptimize your business for local seo with Google Business Profile, local citations, reviews, maps, and location-based SEO.
- Mobile SEOImprove your website’s mobile seo performance with responsive design, mobile-first indexing, usability, and page speed optimization.
- On-Page SEOExplore on-page seo optimization techniques such as title tags, meta descriptions, headings, URLs, internal linking, and content optimization.
- Off-Page SEODiscover off-page SEO strategies such as backlinks, digital PR, brand mentions, outreach, and authority building.
- SEO ToolsExplore the best SEO tools for keyword research, technical audits, backlink analysis, rank tracking, and website optimization.
- Core Web VitalsLearn how to improve Core Web Vitals including LCP, INP, CLS, page speed, and overall user experience for better rankings.
- Keyword ResearchLearn how to find profitable keywords, analyze search intent, evaluate competition, and build effective keyword strategies.
- Link BuildingMaster ethical link building techniques, backlink analysis, outreach methods, guest posting, and authority growth strategies.
- Google Search ConsoleLearn how to use Google Search Console to monitor indexing, fix errors, analyze search performance, and improve SEO.
- SEO BasicsLearn the fundamentals of search engine optimization (SEO Basics), including how search engines work, SEO terminology, and beginner-friendly best practices.
- Paid Media
- Display AdvertisingLearn display advertising strategies, banner ads, audience targeting, remarketing, Google Display campaigns, and optimization techniques.
- Google AdsLearn Google Ads strategies, campaign setup, bidding, keywords, Performance Max, Search Ads, and optimization techniques.
- LinkedIn AdsLearn LinkedIn Ads strategies for B2B marketing, lead generation, audience targeting, campaign optimization, and paid social advertising.
- Meta AdsLearn Meta Ads strategies for Facebook and Instagram, including campaign setup, targeting, retargeting, and performance optimization.
- Paid Media AnalyticsLearn paid media analytics, including CPC, CTR, CPA, ROAS, conversion tracking, attribution, reporting, and campaign performance analysis.
- PPC StrategyLearn effective PPC strategies, campaign planning, bidding, keyword targeting, landing pages, conversion optimization, and more.
- ContentTransform your living spaces with inspiration, tips, and trends in interior design. From minimalist decor to bold statements, find ideas for every style and budget.
- Social
- Digital MarketingExplore stories and advice on living your best life. From personal growth to entertainment, dive into the latest in lifestyle trends and inspiration.
- Artificial IntelligenceStay informed about health and wellness with expert advice, fitness tips, and the latest medical breakthroughs. Your guide to a healthier and happier life.
- DevelopmentYou will find development related educational articles
- GTMLearn Google Tag Manager (GTM) with practical guides for tags, triggers, variables, tracking, conversions, and website analytics implementation.
- HTMLLearn HTML with simple tutorials, examples, tags, elements, attributes, and best practices for building modern web pages.
- HTML CSSLearn HTML CSS together with practical tutorials, examples, layouts, styling techniques, responsive design, and modern web development practices.
- HTML JSLearn HTML JS – JavaScript with practical tutorials and examples for adding interactivity, dynamic content, events, and functionality to web pages.
- JavaScriptExplore JavaScript tutorials, examples, concepts, and practical techniques for creating interactive and dynamic websites and web applications.
- PHPLearn PHP programming with practical tutorials, examples, functions, syntax, and web development techniques for beginners and developers.
- PythonLearn Python programming with practical tutorials, examples, syntax, functions, automation techniques, and useful programming concepts.
Now Reading: Python and Pandas for SEO Reporting: Automate Dashboards in 6 Steps
-
01
Python and Pandas for SEO Reporting: Automate Dashboards in 6 Steps
- Home//
- SEO//Discover the latest updates from across the United States, including politics, culture, economy, and trending stories. Stay informed on the key events shaping the nation and the topics everyone’s talking about.
- Technical SEO//Learn technical SEO concepts including crawling, indexing, XML sitemaps, robots.txt, canonical tags, site architecture, and website performance.
- Local SEO//Optimize your business for local seo with Google Business Profile, local citations, reviews, maps, and location-based SEO.
- Mobile SEO//Improve your website’s mobile seo performance with responsive design, mobile-first indexing, usability, and page speed optimization.
- On-Page SEO//Explore on-page seo optimization techniques such as title tags, meta descriptions, headings, URLs, internal linking, and content optimization.
- Off-Page SEO//Discover off-page SEO strategies such as backlinks, digital PR, brand mentions, outreach, and authority building.
- SEO Tools//Explore the best SEO tools for keyword research, technical audits, backlink analysis, rank tracking, and website optimization.
- Core Web Vitals//Learn how to improve Core Web Vitals including LCP, INP, CLS, page speed, and overall user experience for better rankings.
- Keyword Research//Learn how to find profitable keywords, analyze search intent, evaluate competition, and build effective keyword strategies.
- Link Building//Master ethical link building techniques, backlink analysis, outreach methods, guest posting, and authority growth strategies.
- Google Search Console//Learn how to use Google Search Console to monitor indexing, fix errors, analyze search performance, and improve SEO.
- SEO Basics//Learn the fundamentals of search engine optimization (SEO Basics), including how search engines work, SEO terminology, and beginner-friendly best practices.
- Paid Media//
- Display Advertising//Learn display advertising strategies, banner ads, audience targeting, remarketing, Google Display campaigns, and optimization techniques.
- Google Ads//Learn Google Ads strategies, campaign setup, bidding, keywords, Performance Max, Search Ads, and optimization techniques.
- LinkedIn Ads//Learn LinkedIn Ads strategies for B2B marketing, lead generation, audience targeting, campaign optimization, and paid social advertising.
- Meta Ads//Learn Meta Ads strategies for Facebook and Instagram, including campaign setup, targeting, retargeting, and performance optimization.
- Paid Media Analytics//Learn paid media analytics, including CPC, CTR, CPA, ROAS, conversion tracking, attribution, reporting, and campaign performance analysis.
- PPC Strategy//Learn effective PPC strategies, campaign planning, bidding, keyword targeting, landing pages, conversion optimization, and more.
- Content//Transform your living spaces with inspiration, tips, and trends in interior design. From minimalist decor to bold statements, find ideas for every style and budget.
- Social//
- Digital Marketing//Explore stories and advice on living your best life. From personal growth to entertainment, dive into the latest in lifestyle trends and inspiration.
- Artificial Intelligence//Stay informed about health and wellness with expert advice, fitness tips, and the latest medical breakthroughs. Your guide to a healthier and happier life.
- Development//You will find development related educational articles
- GTM//Learn Google Tag Manager (GTM) with practical guides for tags, triggers, variables, tracking, conversions, and website analytics implementation.
- HTML//Learn HTML with simple tutorials, examples, tags, elements, attributes, and best practices for building modern web pages.
- HTML CSS//Learn HTML CSS together with practical tutorials, examples, layouts, styling techniques, responsive design, and modern web development practices.
- HTML JS//Learn HTML JS – JavaScript with practical tutorials and examples for adding interactivity, dynamic content, events, and functionality to web pages.
- JavaScript//Explore JavaScript tutorials, examples, concepts, and practical techniques for creating interactive and dynamic websites and web applications.
- PHP//Learn PHP programming with practical tutorials, examples, functions, syntax, and web development techniques for beginners and developers.
- Python//Learn Python programming with practical tutorials, examples, syntax, functions, automation techniques, and useful programming concepts.
- Home
- Development
- Python
- Python and Pandas for SEO Reporting: Automate Dashboards in 6 Steps
Python and Pandas for SEO Reporting: Automate Dashboards in 6 Steps

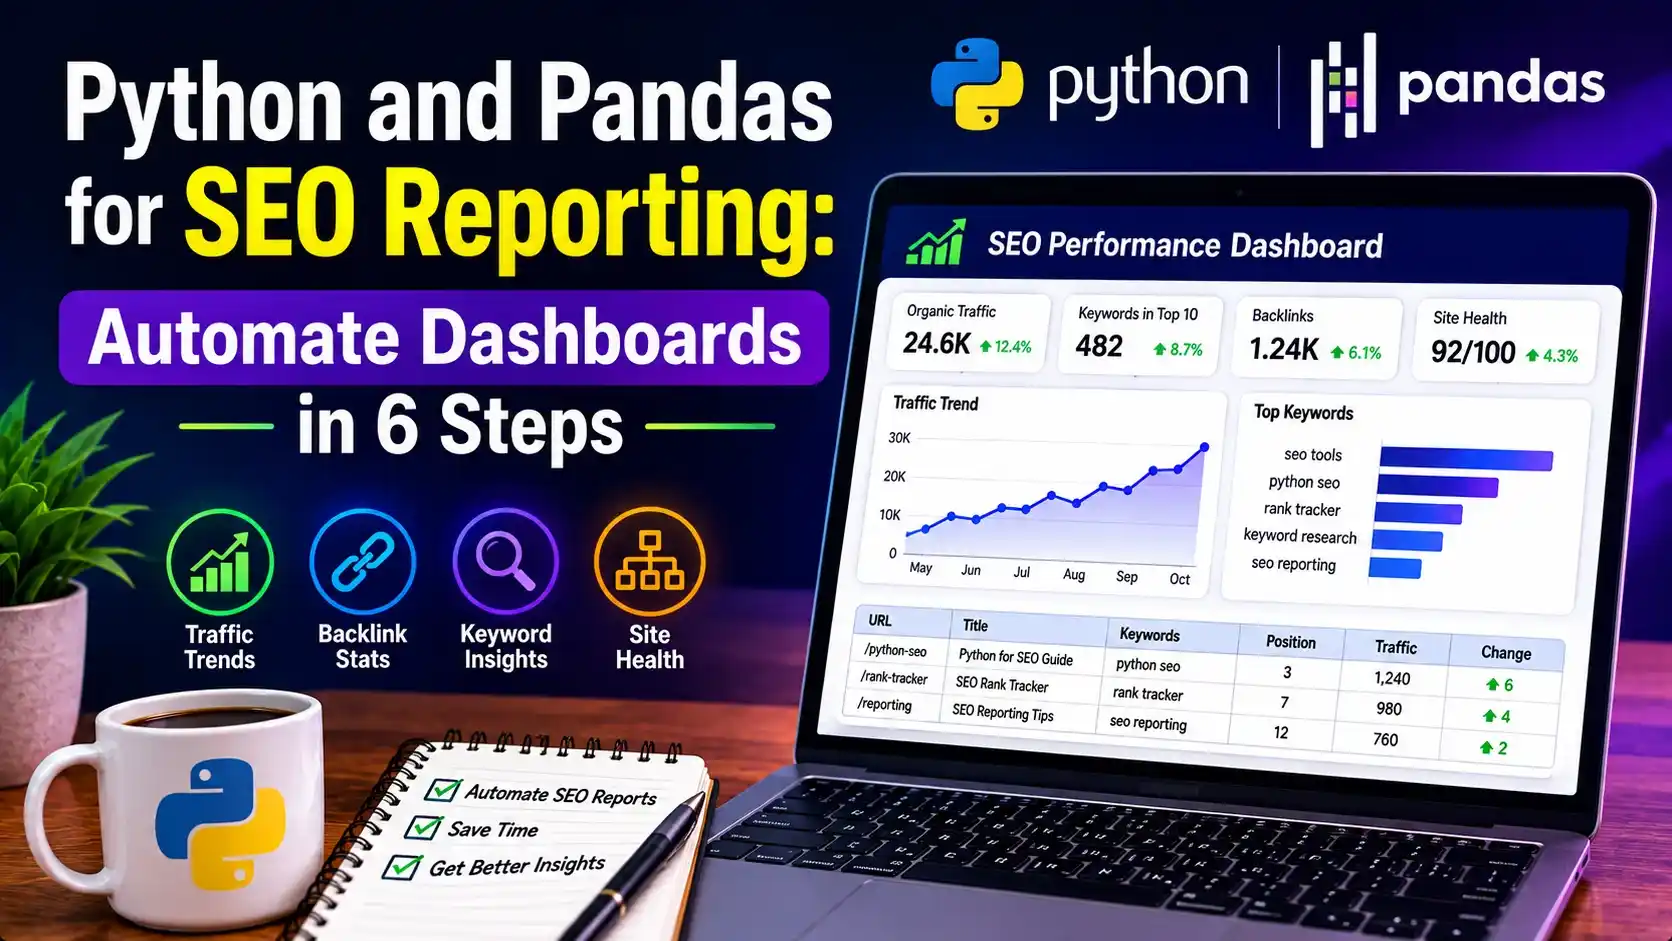
Table of Contents
ToggleCopying numbers from Search Console into a slide deck every Monday morning is not reporting, it is data entry. Python and pandas for SEO reporting turns that same weekly task into a script that runs in minutes and never mistypes a cell.
Why Python and Pandas for SEO Reporting Beats the Manual Client Deck
An agency managing a dozen client accounts spends a real chunk of every month on reporting. Someone exports Search Console data, exports analytics data, and pastes both into a spreadsheet by hand.
Then the same person builds a chart, writes a summary, and repeats the whole process for the next client. Nothing about that process changes month to month except the numbers.
A script replaces the copying step entirely. It pulls the same two data sources, merges them, calculates the same comparisons, and writes the same report shape every time.
The person who used to spend a day on reporting spends that day on the parts a script cannot do, reading the numbers and deciding what they mean for the client.
Setting Up Your Python Environment
Four libraries cover the whole pipeline in this guide, from pulling data to writing the finished report.
# create an isolated environment so package versions don't clash
python -m venv venv
source venv/bin/activate      # Windows: venv\Scripts\activate

pip install pandas google-api-python-client google-analytics-data openpyxl matplotlib
The pandas library does the merging and math. google-api-python-client talks to Search Console, and google-analytics-data is Google's official client for pulling Google Analytics 4 data. openpyxl writes a formatted spreadsheet, and matplotlib draws the trend chart.
All four are documented in full on the Python Package Index, which is worth bookmarking before the first run in case a version pin needs checking later.
Pulling Search Console Data
The Search Console API returns clicks, impressions, and average position for a date range, one row per query or page depending on the dimension requested.
from google.oauth2 import service_account
from googleapiclient.discovery import build
import pandas as pd

SCOPES = ['https://www.googleapis.com/auth/webmasters.readonly']
creds = service_account.Credentials.from_service_account_file(
    'service_account.json', scopes=SCOPES
)
service = build('searchconsole', 'v1', credentials=creds)

def get_gsc_data(site_url, start_date, end_date):
    request = {
        'startDate': start_date,
        'endDate': end_date,
        'dimensions': ['query'],
        'rowLimit': 5000
    }
    response = service.searchanalytics().query(
        siteUrl=site_url, body=request
    ).execute()
    rows = response.get('rows', [])
    return pd.DataFrame([{
        'query': r['keys'][0],
        'clicks': r['clicks'],
        'impressions': r['impressions'],
        'position': round(r['position'], 1)
    } for r in rows])
Running this once for the current month and again for the prior month gives two data frames ready to compare, which is exactly what the report needs.
Pulling Google Analytics 4 Data
Google's official google-analytics-data client wraps the GA4 Data API and returns sessions, users, and conversions in a similar shape to the Search Console pull.
from google.analytics.data_v1beta import BetaAnalyticsDataClient
from google.analytics.data_v1beta.types import RunReportRequest, DateRange, Dimension, Metric
import pandas as pd

client = BetaAnalyticsDataClient()

def get_ga4_data(property_id, start_date, end_date):
    request = RunReportRequest(
        property=f'properties/{property_id}',
        dimensions=[Dimension(name='landingPage')],
        metrics=[Metric(name='sessions'), Metric(name='conversions')],
        date_ranges=[DateRange(start_date=start_date, end_date=end_date)]
    )
    response = client.run_report(request)
    rows = []
    for row in response.rows:
        rows.append({
            'landing_page': row.dimension_values[0].value,
            'sessions': int(row.metric_values[0].value),
            'conversions': float(row.metric_values[1].value)
        })
    return pd.DataFrame(rows)
The property ID and a service account with API access are the only setup pieces here, since the request shape stays the same across every client property.
Merging and Cleaning the Data With Pandas
Search Console rows and GA4 rows rarely line up on the same key out of the box, so a short cleaning step makes the merge reliable.
import pandas as pd

def build_report_frame(gsc_df, ga4_df):
    gsc_df['query'] = gsc_df['query'].str.strip().str.lower()
    combined = pd.concat([gsc_df], ignore_index=True)
    combined['clicks'] = combined['clicks'].fillna(0).astype(int)
    combined['impressions'] = combined['impressions'].fillna(0).astype(int)
    return combined.sort_values('clicks', ascending=False)
fillna matters here because a query that had impressions but zero clicks sometimes comes back missing entirely rather than as a literal zero, and an uncaught blank cell breaks every calculation after it.
Calculating Month Over Month Change
Clients care less about the raw numbers than about the direction they moved, so the report needs a comparison column, not just two tables side by side.
import pandas as pd

def compare_periods(current_df, previous_df, key, metric):
    merged = current_df.merge(
        previous_df, on=key, suffixes=('_now', '_prev'), how='outer'
    ).fillna(0)
    merged[f'{metric}_change'] = merged[f'{metric}_now'] - merged[f'{metric}_prev']
    merged[f'{metric}_pct_change'] = (
        merged[f'{metric}_change'] / merged[f'{metric}_prev'].replace(0, 1) * 100
    ).round(1)
    return merged.sort_values(f'{metric}_change', ascending=False)
The replace(0, 1) guard stops a division by zero from crashing the script the first time a query shows up with no prior month history at all.
| Report Element | Data Source | What It Shows the Client |
|---|---|---|
| Clicks and impressions trend | Search Console API | Whether visibility grew or shrank this month |
| Top movers table | Search Console + pandas merge | Which queries gained or lost the most clicks |
| Landing page sessions | GA4 Data API | Which pages carried the organic traffic |
| Conversion summary | GA4 Data API | Whether the traffic actually converted |
Writing the Client Ready Report
A finished pandas data frame can become a formatted spreadsheet in a few lines, complete with a chart the client can open without any setup on their end. Search Engine Journal's guide to SEO reporting covers what most clients actually want to see in a report, which is worth checking against the layout a script produces.
import pandas as pd
import matplotlib.pyplot as plt

def write_excel_report(report_df, client_name, output_path):
    with pd.ExcelWriter(output_path, engine='openpyxl') as writer:
        report_df.to_excel(writer, sheet_name='Query Performance', index=False)

def save_trend_chart(monthly_totals, output_path):
    fig, ax = plt.subplots(figsize=(8, 4))
    ax.plot(monthly_totals['month'], monthly_totals['clicks'], marker='o', color='#4a9e24')
    ax.set_title('Organic Clicks by Month')
    fig.tight_layout()
    fig.savefig(output_path, dpi=150)
Every client gets the exact same file structure, so opening last month's report and this month's report side by side always feels familiar rather than like a new document to learn.
Reporting Time Saved Calculator
Estimate the hours reclaimed each month by automating client reports with python and pandas for SEO reporting.
Scheduling the Report to Run Automatically
A script that still needs someone to remember to run it every month has only solved half the problem, so scheduling through GitHub Actions closes the loop.
name: Monthly SEO Report
on:
  schedule:
    - cron: '0 6 1 * *'
jobs:
  build_report:
    runs-on: ubuntu-latest
    steps:
      - uses: actions/checkout@v4
      - run: pip install -r requirements.txt
      - run: python build_report.py
The cron entry runs on the first day of every month, so each client report is already sitting in the output folder before anyone thinks to ask for it.
- Store credentials as secrets: the service account JSON and property IDs belong in GitHub Actions secrets, never committed to the repository.
- Keep one config file per client: a small YAML or JSON file per client keeps the same script reusable across every account.
- Log failures loudly: a report that silently fails to generate is worse than one that never existed, since nobody notices until a client asks.
- Version the output folder: keeping a dated copy of every report makes it trivial to compare against any past month, not just the previous one.
- Review before sending: automation builds the report, but a quick human glance before it reaches a client catches the occasional odd number an API returned.
Watch: Python for SEO in Practice
JC Chouinard, whose Search Console API examples this series has referenced before, has also spoken publicly about applying Python across everyday SEO reporting work.
Video credit: JC Chouinard.
The same merge and compare pattern shown in this guide extends easily to a third data source, like a rank tracking export, once the two API pulls above feel familiar.
Related Articles
Frequently Asked Questions
No. Both the Search Console API and the GA4 Data API are free to use within their standard quotas, which comfortably cover a typical agency reporting workload.
A dashboard tool works well for live exploration, but a scripted report gives full control over layout, wording, and exactly which metrics reach the client, with no subscription cost per seat.
Yes. Looping the pull and merge functions across a list of client site URLs and property IDs is the most common way agencies scale this exact setup.
Wrapping each API call in a try block and logging the client name on failure keeps one broken pull from stopping every other client's report that same run.
No. The same data frame can just as easily become a PDF, an HTML email body, or a slide, since pandas is only responsible for the numbers, not the final file format.
What We Learn Today
Manual reporting does not scale
Copying numbers by hand caps how many clients one person can realistically report on.
Two APIs cover most reports
Search Console and GA4 together answer most of what a client wants to know.
Merging needs cleaning first
Mismatched keys and missing values break a merge before it even runs.
Change matters more than totals
Clients respond to direction and movement, not a single raw number.
The output format is flexible
The same data frame can become a spreadsheet, a PDF, or an email body.
Scheduling closes the loop
A report nobody has to remember to run is the actual automation win.
Ready to Automate Your Client Reporting?
Pair python and pandas for SEO reporting with a wider toolkit to keep every client dashboard current without the manual work.
Related Posts
Previous Post
Next Post
Previous Post

Next Post



- Artificial Intelligence
- Content
- Core Web Vitals
- Development
- Digital Marketing
- Display Advertising
- Google Ads
- Google Search Console
- GTM
- HTML
- HTML CSS
- JavaScript
- Keyword Research
- Link Building
- LinkedIn Ads
- Local SEO
- Meta Ads
- Mobile SEO
- Off-Page SEO
- On-Page SEO
- Paid Media
- Paid Media Analytics
- PHP
- PPC Strategy
- Python
- SEO
- SEO Basics
- SEO Tools
- Social
- Technical SEO