
- Home
- SEODiscover the latest updates from across the United States, including politics, culture, economy, and trending stories. Stay informed on the key events shaping the nation and the topics everyone’s talking about.
- Technical SEOLearn technical SEO concepts including crawling, indexing, XML sitemaps, robots.txt, canonical tags, site architecture, and website performance.
- Local SEOOptimize your business for local seo with Google Business Profile, local citations, reviews, maps, and location-based SEO.
- Mobile SEOImprove your website’s mobile seo performance with responsive design, mobile-first indexing, usability, and page speed optimization.
- On-Page SEOExplore on-page seo optimization techniques such as title tags, meta descriptions, headings, URLs, internal linking, and content optimization.
- Off-Page SEODiscover off-page SEO strategies such as backlinks, digital PR, brand mentions, outreach, and authority building.
- SEO ToolsExplore the best SEO tools for keyword research, technical audits, backlink analysis, rank tracking, and website optimization.
- Core Web VitalsLearn how to improve Core Web Vitals including LCP, INP, CLS, page speed, and overall user experience for better rankings.
- Keyword ResearchLearn how to find profitable keywords, analyze search intent, evaluate competition, and build effective keyword strategies.
- Link BuildingMaster ethical link building techniques, backlink analysis, outreach methods, guest posting, and authority growth strategies.
- Google Search ConsoleLearn how to use Google Search Console to monitor indexing, fix errors, analyze search performance, and improve SEO.
- SEO BasicsLearn the fundamentals of search engine optimization (SEO Basics), including how search engines work, SEO terminology, and beginner-friendly best practices.
- Paid Media
- Display AdvertisingLearn display advertising strategies, banner ads, audience targeting, remarketing, Google Display campaigns, and optimization techniques.
- Google AdsLearn Google Ads strategies, campaign setup, bidding, keywords, Performance Max, Search Ads, and optimization techniques.
- LinkedIn AdsLearn LinkedIn Ads strategies for B2B marketing, lead generation, audience targeting, campaign optimization, and paid social advertising.
- Meta AdsLearn Meta Ads strategies for Facebook and Instagram, including campaign setup, targeting, retargeting, and performance optimization.
- Paid Media AnalyticsLearn paid media analytics, including CPC, CTR, CPA, ROAS, conversion tracking, attribution, reporting, and campaign performance analysis.
- PPC StrategyLearn effective PPC strategies, campaign planning, bidding, keyword targeting, landing pages, conversion optimization, and more.
- ContentTransform your living spaces with inspiration, tips, and trends in interior design. From minimalist decor to bold statements, find ideas for every style and budget.
- Social
- Digital MarketingExplore stories and advice on living your best life. From personal growth to entertainment, dive into the latest in lifestyle trends and inspiration.
- Artificial IntelligenceStay informed about health and wellness with expert advice, fitness tips, and the latest medical breakthroughs. Your guide to a healthier and happier life.
- DevelopmentYou will find development related educational articles
- GTMLearn Google Tag Manager (GTM) with practical guides for tags, triggers, variables, tracking, conversions, and website analytics implementation.
- HTMLLearn HTML with simple tutorials, examples, tags, elements, attributes, and best practices for building modern web pages.
- HTML CSSLearn HTML CSS together with practical tutorials, examples, layouts, styling techniques, responsive design, and modern web development practices.
- HTML JSLearn HTML JS – JavaScript with practical tutorials and examples for adding interactivity, dynamic content, events, and functionality to web pages.
- JavaScriptExplore JavaScript tutorials, examples, concepts, and practical techniques for creating interactive and dynamic websites and web applications.
- PHPLearn PHP programming with practical tutorials, examples, functions, syntax, and web development techniques for beginners and developers.
- PythonLearn Python programming with practical tutorials, examples, syntax, functions, automation techniques, and useful programming concepts.
- Home
- SEODiscover the latest updates from across the United States, including politics, culture, economy, and trending stories. Stay informed on the key events shaping the nation and the topics everyone’s talking about.
- Technical SEOLearn technical SEO concepts including crawling, indexing, XML sitemaps, robots.txt, canonical tags, site architecture, and website performance.
- Local SEOOptimize your business for local seo with Google Business Profile, local citations, reviews, maps, and location-based SEO.
- Mobile SEOImprove your website’s mobile seo performance with responsive design, mobile-first indexing, usability, and page speed optimization.
- On-Page SEOExplore on-page seo optimization techniques such as title tags, meta descriptions, headings, URLs, internal linking, and content optimization.
- Off-Page SEODiscover off-page SEO strategies such as backlinks, digital PR, brand mentions, outreach, and authority building.
- SEO ToolsExplore the best SEO tools for keyword research, technical audits, backlink analysis, rank tracking, and website optimization.
- Core Web VitalsLearn how to improve Core Web Vitals including LCP, INP, CLS, page speed, and overall user experience for better rankings.
- Keyword ResearchLearn how to find profitable keywords, analyze search intent, evaluate competition, and build effective keyword strategies.
- Link BuildingMaster ethical link building techniques, backlink analysis, outreach methods, guest posting, and authority growth strategies.
- Google Search ConsoleLearn how to use Google Search Console to monitor indexing, fix errors, analyze search performance, and improve SEO.
- SEO BasicsLearn the fundamentals of search engine optimization (SEO Basics), including how search engines work, SEO terminology, and beginner-friendly best practices.
- Paid Media
- Display AdvertisingLearn display advertising strategies, banner ads, audience targeting, remarketing, Google Display campaigns, and optimization techniques.
- Google AdsLearn Google Ads strategies, campaign setup, bidding, keywords, Performance Max, Search Ads, and optimization techniques.
- LinkedIn AdsLearn LinkedIn Ads strategies for B2B marketing, lead generation, audience targeting, campaign optimization, and paid social advertising.
- Meta AdsLearn Meta Ads strategies for Facebook and Instagram, including campaign setup, targeting, retargeting, and performance optimization.
- Paid Media AnalyticsLearn paid media analytics, including CPC, CTR, CPA, ROAS, conversion tracking, attribution, reporting, and campaign performance analysis.
- PPC StrategyLearn effective PPC strategies, campaign planning, bidding, keyword targeting, landing pages, conversion optimization, and more.
- ContentTransform your living spaces with inspiration, tips, and trends in interior design. From minimalist decor to bold statements, find ideas for every style and budget.
- Social
- Digital MarketingExplore stories and advice on living your best life. From personal growth to entertainment, dive into the latest in lifestyle trends and inspiration.
- Artificial IntelligenceStay informed about health and wellness with expert advice, fitness tips, and the latest medical breakthroughs. Your guide to a healthier and happier life.
- DevelopmentYou will find development related educational articles
- GTMLearn Google Tag Manager (GTM) with practical guides for tags, triggers, variables, tracking, conversions, and website analytics implementation.
- HTMLLearn HTML with simple tutorials, examples, tags, elements, attributes, and best practices for building modern web pages.
- HTML CSSLearn HTML CSS together with practical tutorials, examples, layouts, styling techniques, responsive design, and modern web development practices.
- HTML JSLearn HTML JS – JavaScript with practical tutorials and examples for adding interactivity, dynamic content, events, and functionality to web pages.
- JavaScriptExplore JavaScript tutorials, examples, concepts, and practical techniques for creating interactive and dynamic websites and web applications.
- PHPLearn PHP programming with practical tutorials, examples, functions, syntax, and web development techniques for beginners and developers.
- PythonLearn Python programming with practical tutorials, examples, syntax, functions, automation techniques, and useful programming concepts.
Now Reading: What Is Largest Contentful Paint (LCP)? How to Diagnose and Fix It
-
01
What Is Largest Contentful Paint (LCP)? How to Diagnose and Fix It
- Home//
- SEO//Discover the latest updates from across the United States, including politics, culture, economy, and trending stories. Stay informed on the key events shaping the nation and the topics everyone’s talking about.
- Technical SEO//Learn technical SEO concepts including crawling, indexing, XML sitemaps, robots.txt, canonical tags, site architecture, and website performance.
- Local SEO//Optimize your business for local seo with Google Business Profile, local citations, reviews, maps, and location-based SEO.
- Mobile SEO//Improve your website’s mobile seo performance with responsive design, mobile-first indexing, usability, and page speed optimization.
- On-Page SEO//Explore on-page seo optimization techniques such as title tags, meta descriptions, headings, URLs, internal linking, and content optimization.
- Off-Page SEO//Discover off-page SEO strategies such as backlinks, digital PR, brand mentions, outreach, and authority building.
- SEO Tools//Explore the best SEO tools for keyword research, technical audits, backlink analysis, rank tracking, and website optimization.
- Core Web Vitals//Learn how to improve Core Web Vitals including LCP, INP, CLS, page speed, and overall user experience for better rankings.
- Keyword Research//Learn how to find profitable keywords, analyze search intent, evaluate competition, and build effective keyword strategies.
- Link Building//Master ethical link building techniques, backlink analysis, outreach methods, guest posting, and authority growth strategies.
- Google Search Console//Learn how to use Google Search Console to monitor indexing, fix errors, analyze search performance, and improve SEO.
- SEO Basics//Learn the fundamentals of search engine optimization (SEO Basics), including how search engines work, SEO terminology, and beginner-friendly best practices.
- Paid Media//
- Display Advertising//Learn display advertising strategies, banner ads, audience targeting, remarketing, Google Display campaigns, and optimization techniques.
- Google Ads//Learn Google Ads strategies, campaign setup, bidding, keywords, Performance Max, Search Ads, and optimization techniques.
- LinkedIn Ads//Learn LinkedIn Ads strategies for B2B marketing, lead generation, audience targeting, campaign optimization, and paid social advertising.
- Meta Ads//Learn Meta Ads strategies for Facebook and Instagram, including campaign setup, targeting, retargeting, and performance optimization.
- Paid Media Analytics//Learn paid media analytics, including CPC, CTR, CPA, ROAS, conversion tracking, attribution, reporting, and campaign performance analysis.
- PPC Strategy//Learn effective PPC strategies, campaign planning, bidding, keyword targeting, landing pages, conversion optimization, and more.
- Content//Transform your living spaces with inspiration, tips, and trends in interior design. From minimalist decor to bold statements, find ideas for every style and budget.
- Social//
- Digital Marketing//Explore stories and advice on living your best life. From personal growth to entertainment, dive into the latest in lifestyle trends and inspiration.
- Artificial Intelligence//Stay informed about health and wellness with expert advice, fitness tips, and the latest medical breakthroughs. Your guide to a healthier and happier life.
- Development//You will find development related educational articles
- GTM//Learn Google Tag Manager (GTM) with practical guides for tags, triggers, variables, tracking, conversions, and website analytics implementation.
- HTML//Learn HTML with simple tutorials, examples, tags, elements, attributes, and best practices for building modern web pages.
- HTML CSS//Learn HTML CSS together with practical tutorials, examples, layouts, styling techniques, responsive design, and modern web development practices.
- HTML JS//Learn HTML JS – JavaScript with practical tutorials and examples for adding interactivity, dynamic content, events, and functionality to web pages.
- JavaScript//Explore JavaScript tutorials, examples, concepts, and practical techniques for creating interactive and dynamic websites and web applications.
- PHP//Learn PHP programming with practical tutorials, examples, functions, syntax, and web development techniques for beginners and developers.
- Python//Learn Python programming with practical tutorials, examples, syntax, functions, automation techniques, and useful programming concepts.
- Home
- SEO
- Core Web Vitals
- What Is Largest Contentful Paint (LCP)? How to Diagnose and Fix It
What Is Largest Contentful Paint (LCP)? How to Diagnose and Fix It

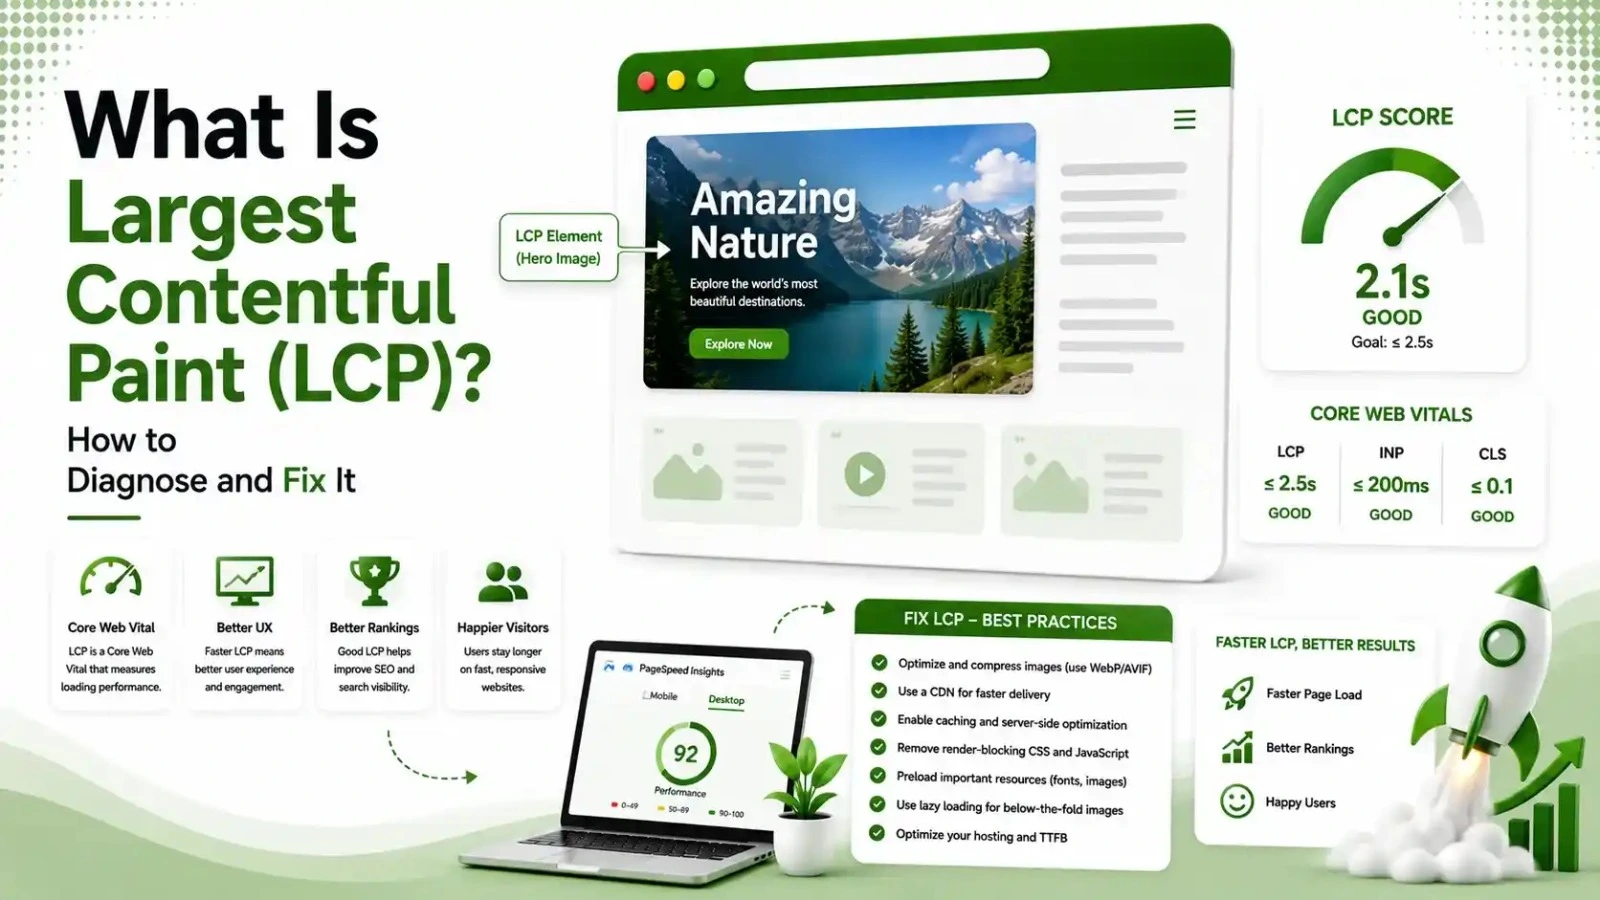
LCP fails on more sites than any other Core Web Vital. Here's exactly what it measures, its four sub-parts, and the highest-impact fixes in priority order.
Table of Contents
ToggleOf the three Core Web Vitals, LCP fails on more sites than the other two combined, according to Chrome User Experience Report data. It is also the most fixable, since LCP problems usually trace back to a handful of well-understood causes rather than the deep JavaScript architecture issues behind INP. Here is exactly what LCP measures and how to fix it when it fails.
Largest Contentful Paint measures how long it takes for the biggest visible element in the viewport to fully render after a page starts loading.
That element is usually a hero image, a video poster frame, or a large block of text. Until that element paints, the page looks blank or half-built to the visitor.
We covered LCP alongside INP and CLS in our broader Core Web Vitals guide. This article goes deep on LCP specifically, since it is the metric most sites actually need to fix first.
The hero image is the LCP element on most pages, the largest visible block in the viewport
of websites fail Google's LCP threshold, per Chrome User Experience Report data
is the "good" LCP threshold Google measures against, for 75% of real visits
of mobile visitors leave a site that takes more than 3 seconds to show content
LCP Thresholds: Good, Needs Improvement, and Poor
Google measures LCP against three bands, based on real-user field data rather than a single lab test.
0-2.5s
2.5-4s
4s+
What Counts as the LCP Element on a Page
Not every element on a page is eligible to be measured as the LCP element. According to Upward Engine's LCP improvement guide, the browser scans the visible viewport for the largest qualifying element.
Qualifying elements include standard image tags, image elements inside SVGs, video poster frames, CSS background images, and block-level text elements. Each type introduces its own delay: images require a separate network request, while text depends on web fonts and any render-blocking CSS finishing first.
The Four Sub-Parts Behind Every LCP Score
Time to First Byte (TTFB)
This is how long the server takes to respond to the initial request. According to Generalist Programmer's 2026 LCP guide, a slow server caps your LCP no matter what other optimizations you apply, since nothing else can start until the server responds.
Load Delay
The gap between the first byte arriving and the browser actually starting to fetch the LCP resource. Render-blocking CSS and JavaScript loaded ahead of the LCP element are the usual cause here.
Load Time
How long the LCP resource itself takes to download once the browser starts fetching it. Large, uncompressed images are the most common culprit in this stage.
Render Delay
The time between the resource finishing its download and actually appearing on screen. Heavy main-thread JavaScript work can hold up rendering even after the file itself has arrived.
Diagnosing Whether Your LCP Problem Is the Server or the Browser
Not every slow LCP has the same root cause. Tap through both scenarios to identify which one matches your situation.
If your TTFB alone is above 800 milliseconds, the problem starts before the browser even begins rendering. According to CoreWebVitals.io's LCP guide, this usually points to slow hosting, an unoptimized database, or a missing CDN, rather than anything on the front end.
If TTFB looks fine but LCP is still slow, the delay is happening in the browser: render-blocking resources, an unoptimized hero image, or heavy JavaScript competing for the main thread before the LCP element can paint.
Highest-Impact LCP Fixes, in Priority Order
| Fix | Targets Which Sub-Part | Typical Impact |
|---|---|---|
| Preload the LCP image with fetchpriority="high" | Load delay | High |
| Reduce server response time (CDN, caching) | Time to First Byte | High |
| Compress and modernize images (WebP, AVIF) | Load time | High |
| Remove render-blocking CSS and JavaScript | Load delay, render delay | Moderate |
| Never lazy-load the LCP element itself | Load delay | Moderate |
Why LCP Matters More on Mobile Than Desktop
Mobile devices consistently show worse LCP scores than desktop, and the reasons are structural rather than accidental. Slower average connection speeds, weaker processors, and higher network latency all compound to push mobile load times past the threshold that desktop connections handle easily.
According to WP Rocket's guide to improving LCP on WordPress, Google evaluates page experience primarily using real mobile field data, so a site that only gets tested on a fast office connection can easily miss serious problems affecting the majority of real visitors.
This gap tends to be largest on image-heavy pages, since a hero image that loads acceptably fast on a strong Wi-Fi connection can take several extra seconds over a typical mobile network, especially without proper compression or a content delivery network in place.
Tools That Help You Track Improvements Over Time
Fixing the metric once is not the same as keeping it fixed. Site changes, new plugins, and added marketing scripts can all quietly push the score back into a failing range months later.
Beyond PageSpeed Insights and Search Console, dedicated monitoring tools track this specific metric continuously and alert you when a page regresses, rather than requiring a manual check every time. This turns page speed into an ongoing practice rather than a one-time project completed and forgotten.
How to Measure Your Own LCP Score
Start in Google Search Console's Core Web Vitals report for real-user field data aggregated across your whole site, split by mobile and desktop.
For page-specific diagnosis, run PageSpeed Insights or Chrome DevTools' Lighthouse panel. According to BulkAudit's 2026 LCP guide, Lighthouse's "Largest Contentful Paint element" diagnostic tells you exactly which element on the page is being measured, which removes the guesswork before you start optimizing.
Once you know the exact element, the Performance tab in Chrome DevTools shows the full loading waterfall, making it clear whether the delay sits in server response, resource loading, or rendering.
A Realistic Before-and-After Fix Walkthrough
Consider a typical ecommerce homepage struggling with a slow score. The page opens with a large, unoptimized banner photo sitting directly above the fold, loaded through a shared hosting plan with no content delivery network in front of it.
The first fix is almost always the server response itself. Moving to a faster host or adding a CDN in front of static assets often shaves a full second or more off the total time before anything even starts rendering.
Every other improvement downstream depends on that first byte arriving quickly, so this step comes first regardless of what else needs fixing on the page.
The second fix targets the banner image directly: converting it to a modern, compressed format and sizing it correctly for the viewport instead of serving an oversized original.
Adding a preload hint so the browser starts fetching it immediately, rather than discovering it partway through the page's script execution, closes out this step.
The third fix removes anything competing with that image for attention during the critical loading window, deferring non-essential scripts like chat widgets or marketing pixels so they load after the important content, not before it or alongside it.
Together, these three changes typically move a struggling homepage from the poor range down into the good range within a single sprint, without requiring a full redesign or migration to a different platform entirely.
How Long It Takes to See Real Improvement
Field data updates on a rolling 28-day window, so changes made today will not immediately show up in Search Console's reporting.
Lab tools like PageSpeed Insights reflect changes instantly, which makes them useful for confirming a fix worked technically before waiting for the slower field data to catch up.
Most sites see their reported score stabilize within two to four weeks after a meaningful round of fixes, assuming no other changes are introduced during that window that might offset the improvement.
Common LCP Mistakes That Undo Good Work
The most common mistake is fixing images while ignoring TTFB. According to CrawlVision's 2026 LCP optimization guide, a slow server response caps your LCP score regardless of how well-optimized your images are, so server-side fixes should never be skipped in favor of front-end tweaks alone.
A second mistake is lazy-loading the LCP element itself. Lazy-loading is meant for content below the fold, and applying it to a hero image or headline text delays the exact element Google is measuring.
A third mistake, according to Whitewood Media's LCP improvement guide, is adding more JavaScript-based monitoring or optimization tools to fix a JavaScript problem, which often makes rendering delay worse rather than better. Sometimes removing scripts helps more than adding new ones.
How LCP Connects to Your Broader Technical SEO
LCP does not exist in isolation. A bloated page with unoptimized images and no CDN also tends to strain the crawl budget issues we covered separately, since heavier pages take longer for crawlers to process too.
Fixing LCP alongside clean schema markup and a well-maintained XML sitemap gives both search engines and AI systems a faster, cleaner site to work with, which increasingly affects citation eligibility as much as it affects traditional rankings.
FAQs on Largest Contentful Paint (LCP)
Related Articles
What We Learn Today
Related Posts
Previous Post
Next Post
- Artificial Intelligence
- Content
- Core Web Vitals
- Development
- Digital Marketing
- Google Ads
- Google Search Console
- GTM
- HTML
- HTML CSS
- JavaScript
- Keyword Research
- Link Building
- Local SEO
- Meta Ads
- Mobile SEO
- Off-Page SEO
- On-Page SEO
- Paid Media
- Paid Media Analytics
- PHP
- PPC Strategy
- Python
- SEO
- SEO Basics
- SEO Tools
- Social
- Technical SEO